MATLAB: An Introduction with Applications
6th Edition
ISBN: 9781119256830
Author: Amos Gilat
Publisher: John Wiley & Sons Inc
expand_more
expand_more
format_list_bulleted
Question
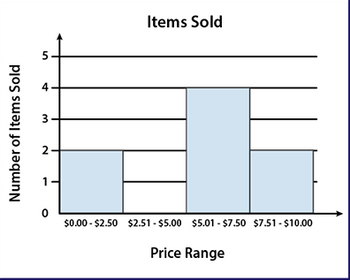
The following histogram shows the number of items sold at a grocery store at various prices:
Which of the following data sets is represented in the histogram?
Group of answer choices
{0.75, 2.50, 2.51, 5.00, 5.01, 7.50, 7.51, 10.00}
{2.50, 2.50, 7.50, 7.50, 7.50, 7.99, 9.25, 10.00}
{2, 0, 4, 2}
{0.50, 2.00, 5.01, 6.25, 7.45, 7.50, 7.89, 9.99}

Transcribed Image Text:Number of Items Sold
2
0
$0.00-$2.50
Items Sold
$2.51 - $5.00 $5.01-$7.50 $7.51-$10.00
Price Range
Expert Solution
This question has been solved!
Explore an expertly crafted, step-by-step solution for a thorough understanding of key concepts.
This is a popular solution
Trending nowThis is a popular solution!
Step by stepSolved in 3 steps

Knowledge Booster
Similar questions
- Find the mode of the data set: 13, 32, 25, 27, 13 O 22 O 13 O 24.5 O 25 Eo search F3 F4 F5 F6 F7 F8 F9 2$ % &arrow_forwardFind median for the data given below : Marks Number of students Greater than 10 70 Greater than 20 62 Greater than 30 50 Greater than 40 38 Greater than 50 30 Greater than 60 24 Greater than 70 17 Greater than 80 9 Greater than 90 4arrow_forwardFind the mean for the following list of weights (in pounds) of boston terriers at a per store: 13,2,14,5,16,9,18,17,25,10arrow_forward
- Find the MODE of the following data set : 18, 101, 105, 201, 203, 206, 235, 301, 304, 367, 479, 507, 567, 809arrow_forwardStaddlad 1. Find the mean, median, and mode of the following data: 26, 52, 37, 22, 24, 45, 58, 28, 39, 60, 25, 47, 23, 56, 28arrow_forwardFind the mode of this set of data: 24, 27, 32, 29, 31, 35, 27, 32, 23, 25, 30, 24, 30, 35, 40arrow_forward
- The following are average points per game for players on the LA Lakers and Miami Heat during the 2019-2020 season: Lakers (20 values): 0, 1.4, 1.5, 2.8, 4.2, 5.1, 5.3, 5.5, 5.7, 6, 6.6, 7.1, 7.5, 8, 8.6, 9.3, 11.9, 12.8, 25.3, 26.1 Heat (21 values): 0.8, 1, 1.4, 2.4, 3, 3, 4.5, 4.6, 5.7, 6.1, 8.2, 8.5, 9.3, 11.3, 11.9, 13.5, 13.5, 15.3, 15.9, 16.2, 19.9 a) Calculate the five-number summary of each. b) Draw boxplots of each. c) Compare the boxplots – how do they differ?arrow_forwardGiven the data set: 6, 19, 17, 23, 20, 10. Determine (i). the percentile rank for each test score,arrow_forwardfor the dataset c(1,2,2,2,4,5,6,6,7,8,9,9), what is the 75% or .75 quantile?arrow_forward
- The following data are the grades of 18 students on an algebra test. 77,74,56,55,85,58,88,71,86,94,63,61,89,61,57,85,93 construct a box-and-whisker plot for the data.arrow_forwardFind the mean for the following group of data items. 5, 6, 2, 8, 1, 3, 4, 8arrow_forwardThe following data were collected in a survey of 8th graders and summarize their cell phone status. What proportion of the 8th graders have cell phones? No cell phone Conventional cell phone Smartphone Boys 50 65 33 Girls 31 76 27arrow_forward
arrow_back_ios
SEE MORE QUESTIONS
arrow_forward_ios
Recommended textbooks for you
 MATLAB: An Introduction with ApplicationsStatisticsISBN:9781119256830Author:Amos GilatPublisher:John Wiley & Sons Inc
 Probability and Statistics for Engineering and th...StatisticsISBN:9781305251809Author:Jay L. DevorePublisher:Cengage Learning
 Statistics for The Behavioral Sciences (MindTap C...StatisticsISBN:9781305504912Author:Frederick J Gravetter, Larry B. WallnauPublisher:Cengage Learning
 Elementary Statistics: Picturing the World (7th E...StatisticsISBN:9780134683416Author:Ron Larson, Betsy FarberPublisher:PEARSON
 The Basic Practice of StatisticsStatisticsISBN:9781319042578Author:David S. Moore, William I. Notz, Michael A. FlignerPublisher:W. H. Freeman
 Introduction to the Practice of StatisticsStatisticsISBN:9781319013387Author:David S. Moore, George P. McCabe, Bruce A. CraigPublisher:W. H. Freeman

MATLAB: An Introduction with Applications
Statistics
ISBN:9781119256830
Author:Amos Gilat
Publisher:John Wiley & Sons Inc

Probability and Statistics for Engineering and th...
Statistics
ISBN:9781305251809
Author:Jay L. Devore
Publisher:Cengage Learning

Statistics for The Behavioral Sciences (MindTap C...
Statistics
ISBN:9781305504912
Author:Frederick J Gravetter, Larry B. Wallnau
Publisher:Cengage Learning

Elementary Statistics: Picturing the World (7th E...
Statistics
ISBN:9780134683416
Author:Ron Larson, Betsy Farber
Publisher:PEARSON

The Basic Practice of Statistics
Statistics
ISBN:9781319042578
Author:David S. Moore, William I. Notz, Michael A. Fligner
Publisher:W. H. Freeman

Introduction to the Practice of Statistics
Statistics
ISBN:9781319013387
Author:David S. Moore, George P. McCabe, Bruce A. Craig
Publisher:W. H. Freeman