The following graph shows the market for loanable funds in a closed economy. The upward-sloping orange line represents the supply of loanable funds, and the downward-sloping blue line represents the demand for loanable funds. INTEREST RATE (Percent) 2 1 10 9 Supply 0 0 100 Demand 200 300 400 500 600 700 800 900 1000 LOANABLE FUNDS (Billions of dollars) ? Investment is the source of the demand for loanable funds. As the interest rate rises, the quantity of loanable funds demanded decreases Suppose the interest rate is 4.5%. Based on the previous graph, the quantity of loanable funds supplied is demanded, resulting in a shortage of loanable funds. This would encourage lenders to raise the interest rates they charge, thereby the quantity of loanable funds supplied and the equilibrium interest rate of % less than the quantity of loans the quantity of loanable funds demanded, moving the market toward
The following graph shows the market for loanable funds in a closed economy. The upward-sloping orange line represents the supply of loanable funds, and the downward-sloping blue line represents the demand for loanable funds. INTEREST RATE (Percent) 2 1 10 9 Supply 0 0 100 Demand 200 300 400 500 600 700 800 900 1000 LOANABLE FUNDS (Billions of dollars) ? Investment is the source of the demand for loanable funds. As the interest rate rises, the quantity of loanable funds demanded decreases Suppose the interest rate is 4.5%. Based on the previous graph, the quantity of loanable funds supplied is demanded, resulting in a shortage of loanable funds. This would encourage lenders to raise the interest rates they charge, thereby the quantity of loanable funds supplied and the equilibrium interest rate of % less than the quantity of loans the quantity of loanable funds demanded, moving the market toward

Chapter21: Financial Markets, Saving, And Investment
Section: Chapter Questions
Problem 6P

Related questions
Question
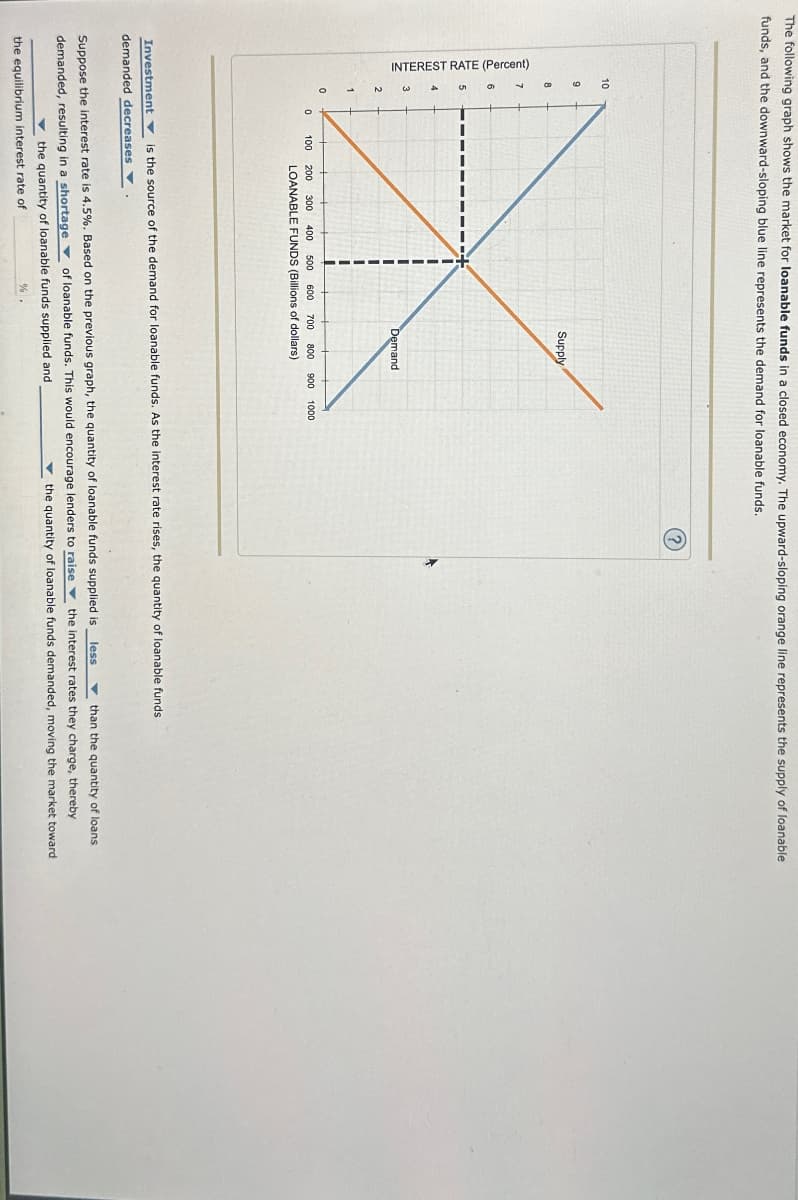
Transcribed Image Text:The following graph shows the market for loanable funds in a closed economy. The upward-sloping orange line represents the supply of loanable
funds, and the downward-sloping blue line represents the demand for loanable funds.
INTEREST RATE (Percent)
2
1
10
9
Supply
0
0
100
Demand
200 300 400 500 600 700 800 900 1000
LOANABLE FUNDS (Billions of dollars)
?
Investment is the source of the demand for loanable funds. As the interest rate rises, the quantity of loanable funds
demanded decreases
Suppose the interest rate is 4.5%. Based on the previous graph, the quantity of loanable funds supplied is
demanded, resulting in a shortage of loanable funds. This would encourage lenders to raise the interest rates they charge, thereby
the quantity of loanable funds supplied and
the equilibrium interest rate of
%
less
than the quantity of loans
the quantity of loanable funds demanded, moving the market toward
Expert Solution
This question has been solved!
Explore an expertly crafted, step-by-step solution for a thorough understanding of key concepts.

This is a popular solution!

Trending now
This is a popular solution!

Step by step
Solved in 2 steps

Recommended textbooks for you
Exploring Economics
Economics
ISBN:
9781544336329
Author:
Robert L. Sexton
Publisher:
SAGE Publications, Inc

Essentials of Economics (MindTap Course List)
Economics
ISBN:
9781337091992
Author:
N. Gregory Mankiw
Publisher:
Cengage Learning

Brief Principles of Macroeconomics (MindTap Cours…
Economics
ISBN:
9781337091985
Author:
N. Gregory Mankiw
Publisher:
Cengage Learning
Exploring Economics
Economics
ISBN:
9781544336329
Author:
Robert L. Sexton
Publisher:
SAGE Publications, Inc
Essentials of Economics (MindTap Course List)
Economics
ISBN:
9781337091992
Author:
N. Gregory Mankiw
Publisher:
Cengage Learning
Brief Principles of Macroeconomics (MindTap Cours…
Economics
ISBN:
9781337091985
Author:
N. Gregory Mankiw
Publisher:
Cengage Learning

Economics: Private and Public Choice (MindTap Cou…
Economics
ISBN:
9781305506725
Author:
James D. Gwartney, Richard L. Stroup, Russell S. Sobel, David A. Macpherson
Publisher:
Cengage Learning

Microeconomics: Private and Public Choice (MindTa…
Economics
ISBN:
9781305506893
Author:
James D. Gwartney, Richard L. Stroup, Russell S. Sobel, David A. Macpherson
Publisher:
Cengage Learning

Macroeconomics: Private and Public Choice (MindTa…
Economics
ISBN:
9781305506756
Author:
James D. Gwartney, Richard L. Stroup, Russell S. Sobel, David A. Macpherson
Publisher:
Cengage Learning