
ENGR.ECONOMIC ANALYSIS
14th Edition
ISBN: 9780190931919
Author: NEWNAN
Publisher: Oxford University Press
expand_more
expand_more
format_list_bulleted
Related questions
Concept explainers
Question
2. Price controls in the Florida orange market Part 2
The following graph shows the annual market for Florida oranges, which are sold in units of 90-pound boxes.
Use the graph input tool to help you answer the following questions. You will not be graded on any changes you make to this graph.
Note: Once you enter a value in a white field, the graph and any corresponding amounts in each grey field will change accordingly.
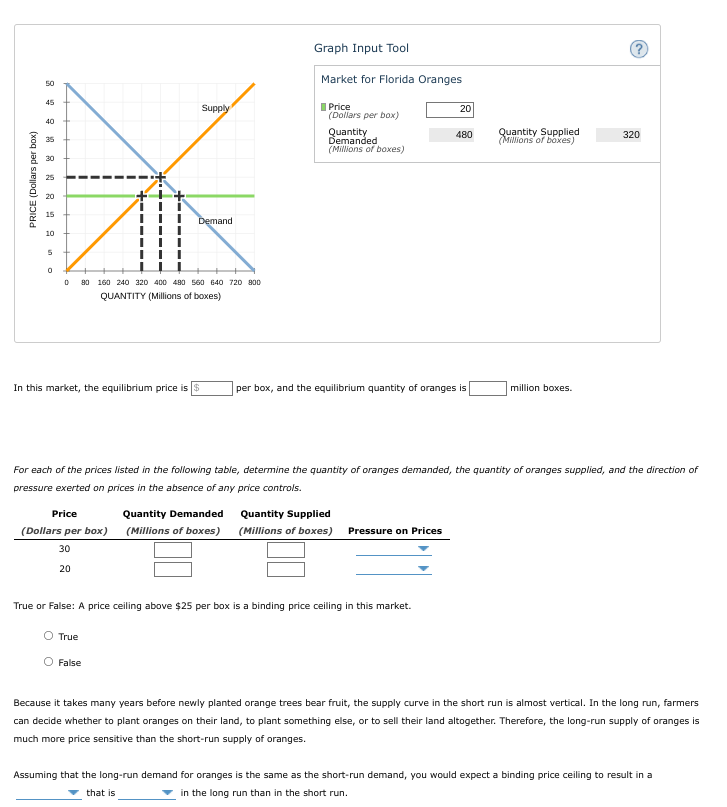

Transcribed Image Text:Graph Input Tool
Market for Florida Oranges
50
45
Supply
I Price
(Dollars per box)
20
40
Quantity
Demanded
(Millions of boxes)
Quantity Supplied
(Millions of boxes)
480
320
35
* 30
25
20
15
Demand
10
90 160 240 320 400 480 560 640 720 800
QUANTITY (Millions of boxes)
In this market, the equilibrium price is $
per box, and the equilibrium quantity of oranges is
million boxes.
For each of the prices listed in the following table, determine the quantity of oranges demanded, the quantity of oranges supplied, and the direction of
pressure exerted on prices in the absence of any price controls.
Price
Quantity Demanded Quantity Supplied
(Dollars per box) (Millions of boxes) (Millions of boxes) Pressure on Prices
30
20
True or False: A price ceiling above $25 per box is a binding price ceiling in this market.
True
False
Because it takes many years before newly planted orange trees bear fruit, the supply curve in the short run is almost vertical. In the long run, farmers
can decide whether to plant oranges on their land, to plant something else, or to sell their land altogether. Therefore, the long-run supply of oranges is
much more price sensitive than the short-run supply of oranges.
Assuming that the long-run demand for oranges is the same as the short-run demand, you would expect a binding price ceiling to result in a
that is
in the long run than in the short run.
PRICE (Dollars per box)
Expert Solution
arrow_forward
Step 1
Equilibrium in the market occurs at the intersection point of market demand and market supply curve.
In this market, the equilibrium price is $25 per box, and the equilibrium quantity of oranges is 400 million boxes.

Trending nowThis is a popular solution!

Step by stepSolved in 2 steps

Knowledge Booster


Learn more about
Need a deep-dive on the concept behind this application? Look no further. Learn more about this topic, economics and related others by exploring similar questions and additional content below.Similar questions
- Indicate the answer choice that best completes the statement or answers the question. 1. (Figure: Demand for jazz shows) The graph shows Jayden's monthly demand curve for live music at a small, local venue. Price per show ($) $20 $18 $16 $14 $12 $10 $8 $6 $4 $2 $0 Demand 0 1 2 3 4 5 6 7 8 9 10 11 12 13 14 Quantity of shows If Jayden currently attends six shows per month, what is probably TRUE? a. The price of a concert ticket is between $9 and $12. b. Jayden does not have enough income to go to more than six shows per month. c. Each concert provides Jayden with the same marginal benefit. d. If the price rose to $18, Jayden would not attend any concerts. Page 1arrow_forwarde Price -Q₁ Quantity Which of the following scenarios is BEST represented in the graph? A number of sellers increase B decrease in government taxes C resource costs increase D technology improvesarrow_forwardQuestion: Explain the concept of supply and demand and how they interact to determine prices and quantities in a market.Please Dont use AI tool.arrow_forward
- Consider the scenario. Explain using written and graphical analysis What will happen in the market for tomatoes if a new study is released that showsthat pesticides used on tomatoes contain cancer forming agents.arrow_forwardRefer to the figure, Price (dollars) 600 550 500 450 400 350 300 250 200 150 100 50 0 Market for Game Consoles S 10 20 30 40 50 60 70 80 90 100110 Quantity Toola DL 0 O Use the graph to show the area representing the deadweight loss, and then determine the deadweight loss created as a result of setting the price at $150. Instructions: Use the tool provided "DL to illustrate this area on the graph. Deadweight loss: $arrow_forwardhelp please answer in text form with proper workings and explanation for each and every part and steps with concept and introduction no AI no copy paste remember answer must be in proper format with all workingarrow_forward
- MICROECONOMICS Questions 3 ( ALL OF IT IS ONE QUESTION!!!) For article 3 write the number of the graph that best describes what happened. Fill in only the appropriate boxes in the chart for article 3 and be sure and indicate if it is an increase or a decrease. For the graph use an arrow to indicate an increase or a decrease. Make sure you fill in the graph PLEASE Leave it blank if there is no change Masks (Now). The easing Covid-19 pandemic is expected to reduce demand for medical masks this year, joining a group of companies that have forecast a decline in business from Covid-19 prevention. Masks became a billion-dollar business for the St. Paul, Minn., manufacturer starting in 2020, when the virus’s rapid spread sent consumers and healthcare workers looking to secure facial coverings to try to avoid infection. Now, as the latest U.S. surge caused by the Omicron variant fades, 3M said they are seeing slowing mask sales. WHICH GRAPH BEST FITS THE ARTICLE. Graph # Graph…arrow_forwardGovernment-imposed taxes cause reductions in the activity that is being taxed, which has important implications for revenue collections. To understand the effect of such a tax, consider the monthly market for wine, which is shown on the following graph. Use the graph input tool to help you answer the following questions. You will not be graded on any changes you make to this graph. Note: Once you enter a value in a white field, the graph and any corresponding amounts in each grey field will change accordingly. PRICE (Dollars per case) 50 45 40 35 30 25 20 15 10 5 0 1 Supply Demand 09 18 27 36 45 54 63 72 81 90 QUANTITY (Cases) Graph Input Tool Suppose the government imposes a $10-per-case tax on suppliers. At this tax amount, the equilibrium quantity of wine is Market for Wine Quantity (Cases) Demand Price (Dollars per case) Tax (Dollars per case) 36 30.00 10.00 Supply Price (Dollars per case) cases, and the government collects $ ? 20.00 in tax revenue.arrow_forwardComplete the following table by selecting the term that matches each definition. Definition The claim that, other things being equal, the quantity supplied of a good increases when the price of that good rises The amount of a good that sellers are willing and able to supply at a given price A graphical object showing the relationship between the price of a good and the amount that sellers are willing and able to supply at various prices A table showing the relationship between the price of a good and the amount of it that sellers are willing and able to supply at various prices PRICE (Dollars per Record) 20 18 Apply your understanding of the previous key terms by completing the following scenario with the appropriate terminology. 16 14 12 10 8 4 Your professor claims that one of the curves found on the following graph correctly illustrates the supply curve for records: 2 0 0 $₂ S 1 1 2 6 7 3 5 QUANTITY (Millions of Records) 4 Quantity Supplied 8 9 10 Supply Curve O (?) O O Supply…arrow_forward
- Attempts Keep the Highest/4 1. Price controls in the Florida orange market The following graph shows the annual market for Michigan blueberries, which are sold in units of 50-pound boxes. Use the graph input tool to help you answer the following questions. You will not be graded on any changes you make to this graph. Note: Once you enter a value in a white field, the graph and any corresponding amounts in each grey field will change accordingly. NBK BRB PROCE (Dolar per box) 10 5 • Graph Input Tool Market for Michigan Blueberries Supply Price (Dollars per box) 15 Quantity Demanded 500 Quantity Supplied (Man of box) 210 (Mons of box) Demand 50 100 150 200 250 300 350 400 450 500 QUANTITY (Mons of In this market, the equilibrium price is per box, and the equilibrium quantity of blueberries is million boxes. For each of the prices listed in the following table, determine the quantity of blueberries demanded, the quantity of blueberries supplied, and the direction of pressure exerted on…arrow_forwardEconomists like to calculate the percent changes in numbers. If the price of gasoline was $3.25 a gallon last week and this week it is $3.95 a gallon, what is the percentage change in price? 33.3 percent 82.3 percent 21.5 percent 17.7 percentarrow_forward
arrow_back_ios
arrow_forward_ios
Recommended textbooks for you
 Principles of Economics (12th Edition)EconomicsISBN:9780134078779Author:Karl E. Case, Ray C. Fair, Sharon E. OsterPublisher:PEARSON
 Engineering Economy (17th Edition)EconomicsISBN:9780134870069Author:William G. Sullivan, Elin M. Wicks, C. Patrick KoellingPublisher:PEARSON
 Principles of Economics (MindTap Course List)EconomicsISBN:9781305585126Author:N. Gregory MankiwPublisher:Cengage Learning
 Managerial Economics: A Problem Solving ApproachEconomicsISBN:9781337106665Author:Luke M. Froeb, Brian T. McCann, Michael R. Ward, Mike ShorPublisher:Cengage Learning
 Managerial Economics & Business Strategy (Mcgraw-...EconomicsISBN:9781259290619Author:Michael Baye, Jeff PrincePublisher:McGraw-Hill Education
Principles of Economics (12th Edition)
Economics
ISBN:9780134078779
Author:Karl E. Case, Ray C. Fair, Sharon E. Oster
Publisher:PEARSON
Engineering Economy (17th Edition)
Economics
ISBN:9780134870069
Author:William G. Sullivan, Elin M. Wicks, C. Patrick Koelling
Publisher:PEARSON
Principles of Economics (MindTap Course List)
Economics
ISBN:9781305585126
Author:N. Gregory Mankiw
Publisher:Cengage Learning
Managerial Economics: A Problem Solving Approach
Economics
ISBN:9781337106665
Author:Luke M. Froeb, Brian T. McCann, Michael R. Ward, Mike Shor
Publisher:Cengage Learning
Managerial Economics & Business Strategy (Mcgraw-...
Economics
ISBN:9781259290619
Author:Michael Baye, Jeff Prince
Publisher:McGraw-Hill Education