ENGR.ECONOMIC ANALYSIS
14th Edition
ISBN: 9780190931919
Author: NEWNAN
Publisher: Oxford University Press
expand_more
expand_more
format_list_bulleted
Question

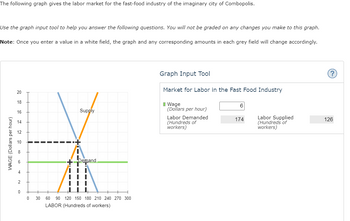
Transcribed Image Text:The following graph gives the labor market for the fast-food industry of the imaginary city of Combopolis.
Use the graph input tool to help you answer the following questions. You will not be graded on any changes you make to this graph.
Note: Once you enter a value in a white field, the graph and any corresponding amounts in each grey field will change accordingly.
WAGE (Dollars per hour)
20
18
16
14
2
0
0
30
Supply
Demand
|||
60 90 120 150 180 210 240 270 300
LABOR (Hundreds of workers)
Graph Input Tool
Market for Labor in the Fast Food Industry
Wage
(Dollars per hour)
Labor Demanded
(Hundreds of
workers)
6
174
Labor Supplied
(Hundreds of
workers)
126

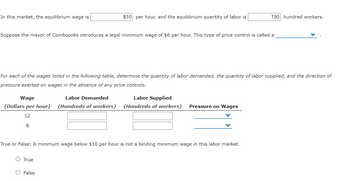
Transcribed Image Text:In this market, the equilibrium wage is
$10 per hour, and the equilibrium quantity of labor is
Suppose the mayor of Combopolis introduces a legal minimum wage of $6 per hour. This type of price control is called a
For each of the wages listed in the following table, determine the quantity of labor demanded, the quantity of labor supplied, and the direction of
pressure exerted on wages in the absence of any price controls.
Wage
Labor Demanded
Labor Supplied
(Dollars per hour) (Hundreds of workers) (Hundreds of workers) Pressure on Wages
12
8
True or False: A minimum wage below $10 per hour is not a binding minimum wage in this labor market.
O True
150 hundred workers.
O False
Expert Solution
This question has been solved!
Explore an expertly crafted, step-by-step solution for a thorough understanding of key concepts.
This is a popular solution
Trending nowThis is a popular solution!
Step by stepSolved in 3 steps

Knowledge Booster
Learn more about
Need a deep-dive on the concept behind this application? Look no further. Learn more about this topic, economics and related others by exploring similar questions and additional content below.Similar questions
- Complete the following table by selecting the term that matches each definition on the left. Definition The graphical representation of the relationship between the wage rate and the quantity of labor workers are willing to provide in a market The graphical representation of the relationship between the wage rate and the quantity of labor firms are willing to hire in a market The additional revenue the firm receives from selling the output produced from an additional unit of labor The increase in the amount of output from an additional unit of labor Market Labor Supply Curve Market Labor Demand Curve Marginal Product of Labor O Which of the following events may increase the marginal product of labor? Check all that apply. A technological improvement that is substitutable for the labor in this market Good weather causes an increase in supply and a fall in price for one of the inputs used to make the good A technological improvement that is complementary for this type of labor A decrease…arrow_forwardIn Houston, 180 people are willing to work an hour as hostesses if the wage is $10 per hour. For each additional $5 that the wage rises above $10, an additional 45 people are willing to work an hour. For wages of $10, $15, $20, $25, and $30 per hour, plot the daily labor supply curve for hostesses on the following graph. WAGE (Dollars per hour) 50 45 40 35 30 20 15 10 5 0 77°F Mostly sunny 0 45 90 315 225 270 135 180 LABOR (Number of workers) 360 405 450 -- Supply C Oarrow_forwardThe current quantity demanded of hairdressers is 47,00047,000, and the average salary in the labor market is $27,000$27,000 per year. Recently, several salons closed due to competition, which led to employers demanding only 36,00036,000 hairdressers.Assuming that when quantity demanded decreases by 1,1001,100 workers, the average salary will decrease by $500$500, calculate the new salary in the labor market. Write the exact answer. Do not round.arrow_forward
- You are given a scenario where this a change in a factor of production or a change in demand for an item. You need to explain in sentence form how this would change demand for labor. You own a sports equipment manufacturing firm. You were just informed rent at your warehouse space would double.arrow_forwardThe following graph shows the labor market in the fast-food industry in the fictional town of Supersize City. Use the graph input tool to help you answer the following questions. You will not be graded on any changes you make to this graph. Note: Once you enter a value in a white field, the graph and any corresponding amounts in each grey field will change accordingly. WAGE (Dollars per hour) 20 18 16 14 2 0 0 Supply Demand 50 100 150 200 250 300 350 400 450 500 LABOR (Thousands of workers) Graph Input Tool Market for Labor in the Fast Food Industry Wage (Dollars per hour) Labor Demanded (Thousands of workers) 6 500 Labor Supplied (Thousands of workers) 0arrow_forwardECON 122: Short Writing Assignment #3 Suppose there are two different labor markets, A and B, each with identical demand for labor curves. If the Supply curves are also identical, draw a graph of each labor market in the space below: Now, assume that Market A's working conditions - for some reason - become much harsher than that for Market B (perhaps they are more dangerous or unhealthy). Illustrate how this development would impact your graph(s) above. What impact would this have on the wages in Market A relative to Market B? How about on total employment in each market? Why?arrow_forward
- Note: Once you enter a value in a white field, the graph and any corresponding amounts in each grey field will change accordingly. Graph Input Tool Market for Teapots 100 I Price (Dollars per teapot) 90 20 Supply 80 Quantity Supplied (Teapots) Quantity Demanded 190 310 70 (Teapots) 60 50 40 Demand 30 20 10 50 100 150 200 250 300 350 400 450 500 QUANTITY (Teapots) The equilibrium price in this market is $ per teapot, and the equilibrium quantity is teapots bought and sold per month. Complete the following table by indicating at each price whether there is a shortage or surplus in the market, the amount of that shortage or surplus, and whether this places upward or downward pressure on prices. Price Shortage or Surplus Amount (Dollars per teapot) Shortage or Surplus (Teapots) Pressure 40 60 PRICE (Dollars per teapot)arrow_forwardQ8 In the Canadian labour market, demand for labour can be impacted by elasticity of the product in which labour is an input. Suppose that the labour cost to total cost ratio in industry A (cannabis sector) is 14 percent, while in industry B (fertilizer sector) it is 68 percent. Other things equal, labour demand will be Multiple Choice more elastic in industry B than in A. constant in both industries A and B. relatively elastic in both industries A and B. relatively inelastic in both industries A and B. more elastic in industry A than in B.arrow_forward
arrow_back_ios
arrow_forward_ios
Recommended textbooks for you

 Principles of Economics (12th Edition)EconomicsISBN:9780134078779Author:Karl E. Case, Ray C. Fair, Sharon E. OsterPublisher:PEARSON
 Engineering Economy (17th Edition)EconomicsISBN:9780134870069Author:William G. Sullivan, Elin M. Wicks, C. Patrick KoellingPublisher:PEARSON
 Principles of Economics (MindTap Course List)EconomicsISBN:9781305585126Author:N. Gregory MankiwPublisher:Cengage Learning
 Managerial Economics: A Problem Solving ApproachEconomicsISBN:9781337106665Author:Luke M. Froeb, Brian T. McCann, Michael R. Ward, Mike ShorPublisher:Cengage Learning
 Managerial Economics & Business Strategy (Mcgraw-...EconomicsISBN:9781259290619Author:Michael Baye, Jeff PrincePublisher:McGraw-Hill Education


Principles of Economics (12th Edition)
Economics
ISBN:9780134078779
Author:Karl E. Case, Ray C. Fair, Sharon E. Oster
Publisher:PEARSON

Engineering Economy (17th Edition)
Economics
ISBN:9780134870069
Author:William G. Sullivan, Elin M. Wicks, C. Patrick Koelling
Publisher:PEARSON

Principles of Economics (MindTap Course List)
Economics
ISBN:9781305585126
Author:N. Gregory Mankiw
Publisher:Cengage Learning

Managerial Economics: A Problem Solving Approach
Economics
ISBN:9781337106665
Author:Luke M. Froeb, Brian T. McCann, Michael R. Ward, Mike Shor
Publisher:Cengage Learning

Managerial Economics & Business Strategy (Mcgraw-...
Economics
ISBN:9781259290619
Author:Michael Baye, Jeff Prince
Publisher:McGraw-Hill Education