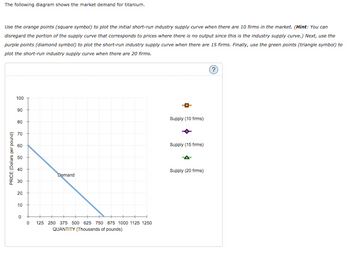
If there were 20 firms in this market, the short-run
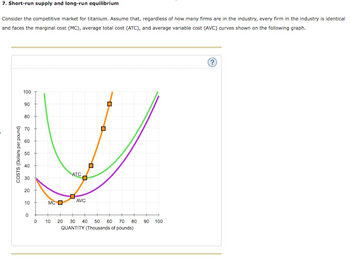
Because you know that competitive firms earn ________ (zero/ negative/ positive) economic profit in the long run, you know the long-run equilibrium price must be $_____ per pound. From the graph, you can see that this means there will be ______ (10/ 15/ 20) firms operating in the titanium industry in long-run equilibrium.


Trending nowThis is a popular solution!
Step by stepSolved in 4 steps with 3 images

- (Figure: Profit-Maximization for Fabulous Finn's Flower Firm in the Short Run) Use Figure: Profit-Maximization for Fabulous Finn's Flower Firm in the Short Run. If the market price is Pa: Price, ATC, AVC, and MC (per unit) P2 91 92 9 Quantity (per perlod) firms will leave the industry, and the price will fall in the long run. there will be economic profits, and firms will enter the industry in the long run. the market supply curve will shift to the left, and price will fall in the long run. O the firm will produce q4 O Oarrow_forward3] Assume several identical firms have the short run production function Q = √40L and pay a wage of 10 for each unit of labor employed. Fixed costs for each firm are 100. The market demand for the good is Qd = 100,000.25P. How many firms are in the industry in the long run?arrow_forwardOnly typed answerarrow_forward
- Please correct answer and don't use hend raitingarrow_forwardExplain how the following events may affect the profit rate for a U.S. firm and industry (be sure to define your measure(s) of the profit rate) :Consider both the immediate impact and the possible long run implications: (1) across firms within an industry; (2) across industries and (3) across nations please long and mindful answers that covers all three categories. j) Removal of all subsidies to the U.S. agriculture sector k) Reduction in the federal tax rate on profit incomearrow_forwardAssume that the cost data in the following table are for a purely competitive producer: Average Average Average Total Variable Marginal Cost Total Fixed Product Cost Cost Cost 1 $60.00 $45.00 $105.00 $ 45.00 30.00 42.50 72.50 40.00 3 20.00 40.00 60.00 35.00 4 15.00 37.50 52.50 30.00 12.00 37.00 49.00 35.00 6. 10.00 37.50 47.50 40.00 7 8.57 38.57 47.14 45.00 7.50 40.63 48.13 55.00 9. 6.67 43.33 50.00 65.00 10 6.00 46.50 52.50 75.00 Instructions: If you are entering any negative numbers be sure to include a negative sign (-) in front of those numbers. Select "Not applicable" and enter a value of "0" for output if the firm does not produce. a. At a product price of $57.00 (i) Will this firm produce in the short run? (Click to select) V (ii) If it is preferable to produce, what will be the profit-maximizing or loss-minimizing output? |(Click to select V output = units per firm (iii) What economic profit or loss will the firm realize per unit of output? |(Click to select v per unit = $ b.…arrow_forward
- 9 Consider the competitive market for titanium. Assume that, regardless of how many firms are in the industry, ever n in the industry is identical and faces the marginal cost (MC), average total cost (ATC), and average variable cost (AVC) curves shown on the following graph. Esc 78°F Sunny 100 COSTS (Dollars per pound) 90 80 70 60 4 50 + 40 + 30 20 10 0 MC O 05 F2 ATC AVC F3 0 10 15 20 25 30 35 40 QUANTITY (Thousands of pounds) 0+ ☐ F4 45 50 F5 H M OL F6 M (?) F7 10 F8 At ( F9 F10 F11 F12 2 Fnarrow_forwardNonearrow_forwardIf there were 10 firms in this market, the short-run equilibrium price of steel would be $______per ton. At that price, firms in this industry would ______(shut down/operate at a loss/ earn a positive profit/ earn zero profit). Therefore, in the long run, firms would__________(enter/ exit/ neither enter nor exit) the steel market. Because you know that competitive firms earn______(zero/ negative/ positive) economic profit in the long run, you know the long-run equilibrium price must be $_____per ton. From the graph, you can see that this means there will be_____(10/20/30) firms operating in the steel industry in long-run equilibrium.arrow_forward
- Q27arrow_forwardPrice (dollars) 8 7 6 5 4 3 2 1 0 80 O increase; increase; increase O remain same; remain same; decrease O decrease; remain same; decrease O decrease; decrease; decrease Short-run Short-run MC AC 100 110 The graph above shows the cost curves for a firm selling in a perfectly competitive market. If the market demand falls due to a recession, the long run equilibrium price will output will ., the firm's and industry output will Output (per day) Long-run ACarrow_forwardthe orange square points on the marginal cost curve from low to high(16,12) (24,20),(30,36),(32,44),(34,52),(38,72)arrow_forward

 Principles of Economics (12th Edition)EconomicsISBN:9780134078779Author:Karl E. Case, Ray C. Fair, Sharon E. OsterPublisher:PEARSON
 Engineering Economy (17th Edition)EconomicsISBN:9780134870069Author:William G. Sullivan, Elin M. Wicks, C. Patrick KoellingPublisher:PEARSON
 Principles of Economics (MindTap Course List)EconomicsISBN:9781305585126Author:N. Gregory MankiwPublisher:Cengage Learning
 Managerial Economics: A Problem Solving ApproachEconomicsISBN:9781337106665Author:Luke M. Froeb, Brian T. McCann, Michael R. Ward, Mike ShorPublisher:Cengage Learning
 Managerial Economics & Business Strategy (Mcgraw-...EconomicsISBN:9781259290619Author:Michael Baye, Jeff PrincePublisher:McGraw-Hill Education


