
MATLAB: An Introduction with Applications
6th Edition
ISBN: 9781119256830
Author: Amos Gilat
Publisher: John Wiley & Sons Inc
expand_more
expand_more
format_list_bulleted
Related questions
Concept explainers
Topic Video
Question
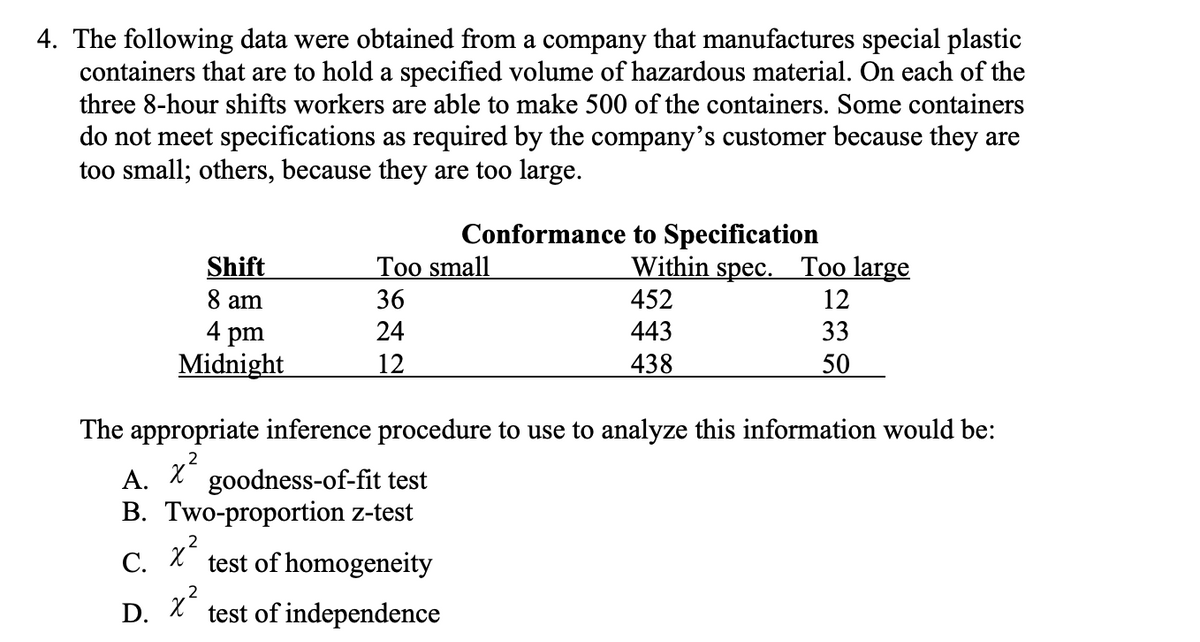

Transcribed Image Text:4. The following data were obtained from a company that manufactures special plastic
containers that are to hold a specified volume of hazardous material. On each of the
three 8-hour shifts workers are able to make 500 of the containers. Some containers
do not meet specifications as required by the company's customer because they are
too small; others, because they are too large.
Conformance to Specification
Shift
Too small
Within spec. Too large
8 am
36
452
12
4 pm
Midnight
24
443
33
12
438
50
The appropriate inference procedure to use to analyze this information would be:
.2
А.
goodness-of-fit test
B. Two-proportion z-test
test of homogeneity
x²
С.
D.
test of independence
Expert Solution
This question has been solved!
Explore an expertly crafted, step-by-step solution for a thorough understanding of key concepts.

This is a popular solution

Trending nowThis is a popular solution!

Step by stepSolved in 2 steps

Knowledge Booster


Learn more about
Need a deep-dive on the concept behind this application? Look no further. Learn more about this topic, statistics and related others by exploring similar questions and additional content below.Similar questions
- No. Emp. No. Prod. Wkrs. Value Added by Mfg. Cost of Materials Value of Indus. Shipmnts New Cap. Exp. End Yr. Inven. Indus. Grp. 433 370 23518 78713 4 1833 3630 1 131 83 15724 42774 4 1056 3157 1 204 169 24506 27222 4 1405 8732 1 100 70 21667 37040 4 1912 3407 1 220 137 20712 12030 4 1006 1155 1 89 69 12640 13674 3 873 3613 1 26 18 4258 19130 3 487 1946 1 143 72 35210 33521 4 2011 7199 1 171 126 20548 19612 4 1135 3135 1 21 15 23442 5557 3 605 5506 2 3 2 287 163 1 2 42 2 2 2 1508 314 1 15 155 2 6 4 624 2622 1 27 554 2 52 47 2471 4219 2 292 929 3 74 63 4307 5357 2 454 1427 3 13 12 673 1061 1 20 325 3 17 13 817 707 1 84 267 3 169 147 8986 10421 3 534 2083 3 51 41 3145 4140 2 220 697 3 55 44 4076 7125 2 176 1446 3 84 76 3806 8994 2 423 1014 3 61 47 4276 5504 2 464 1291 3 27 22 1239 716 1 22 356 4 200 178 9423 8926 3 200 2314 4 294 250 11045 11121 3 189 2727 4 38 32 1916 2283 1 29 682 4 17 14 599 364 1 21 197 4 34 28 2063 1813 1 20…arrow_forwardNo. Emp. No. Prod. Wkrs. Value Added by Mfg. Cost of Materials Value of Indus. Shipmnts New Cap. Exp. End Yr. Inven. Indus. Grp. 433 370 23518 78713 4 1833 3630 1 131 83 15724 42774 4 1056 3157 1 204 169 24506 27222 4 1405 8732 1 100 70 21667 37040 4 1912 3407 1 220 137 20712 12030 4 1006 1155 1 89 69 12640 13674 3 873 3613 1 26 18 4258 19130 3 487 1946 1 143 72 35210 33521 4 2011 7199 1 171 126 20548 19612 4 1135 3135 1 21 15 23442 5557 3 605 5506 2 3 2 287 163 1 2 42 2 2 2 1508 314 1 15 155 2 6 4 624 2622 1 27 554 2 52 47 2471 4219 2 292 929 3 74 63 4307 5357 2 454 1427 3 13 12 673 1061 1 20 325 3 17 13 817 707 1 84 267 3 169 147 8986 10421 3 534 2083 3 51 41 3145 4140 2 220 697 3 55 44 4076 7125 2 176 1446 3 84 76 3806 8994 2 423 1014 3 61 47 4276 5504 2 464 1291 3 27 22 1239 716 1 22 356 4 200 178 9423 8926 3 200 2314 4 294 250 11045 11121 3 189 2727 4 38 32 1916 2283 1 29 682 4 17 14 599 364 1 21 197 4 34 28 2063 1813 1 20…arrow_forwardA dealer in recycled paper places empty trailers at various sites. The trailers are gradually filled by individuals who bring in old newspapers and magazines, and are picked up on several schedules. One such schedule involves pickup every second week. This schedule is desirable if the average amount of recycled paper is more than 1,600 cubic feet per 2-week period. The dealer’s records for eighteen 2-week periods show the following volumes (in cubic feet) at a particular site CubicFeet1,6601,5701,8201,7001,5901,9001,4401,8001,7301,7701,6802,0101,7501,5801,7201,6201,9001,690 Is there enough evidence to suggest that two-week pick-up schedule is desirable? Use 5% significance level. Clearly state the 6 steps of the hypothesis test you do and show all your work. NOTE: Since you have the data make sure to check if the the conditions for the above test are satisfied.arrow_forward
- A dealer in recycled paper places empty trailers at various sites. The trailers are gradually filled by individuals who bring in old newspapers and magazines and are picked up on several schedules. One such schedule involves pickup every second week. This schedule is desirable if the average amount of recycled paper is more than 1,600 cubic feet per 2-week period. The dealer’s records for 18 2-week periods show the following volumes (in cubic feet) at a particular site: 1,660 1,820 1,590 1,440 1,730 1,680 1,750 1,720 1,900 1,570 1,700 1,900 1,800 1,770 2,010 1,580 1,620 1,690 ȳ = 1,718.3 and s = 137 .8 Assuming the 18 2-week periods are fairly typical of the volumes throughout the year, is there significant evidence that the average volume m is greater than 1,600 cubic feet? Place a 95% confidence interval on m. Compute the p-value for the test statistic. Is there strong evidence that m is greater than 1,600?arrow_forwardShortleaf Pines. The ability to estimate the volume of a tree based on a simple measurement, such as the diameter of the tree, is important to the lumber industry, ecologists, and conservationists. Data on volume, in cubic feet, and diameter at breast height, in inches, for 70 shortleaf pines was reported in C. Bruce and F. X. Schumacher’s Forest Mensuration (New York: McGraw-Hill, 1935) and analyzed by A. C. Akinson in the article “Transforming Both Sides of a Tree” (The American Statistician, Vol. 48, pp. 307–312). The data are provided on the WeissStats site. a. obtain and interpret the standard error of the estimate. b. obtain a residual plot and a normal probability plot of the residuals. c. decide whether you can reasonably consider Assumptions 1–3 for regression inferences met by the two variables under consideration.arrow_forwardThe department of zoology at the Virginia Polytechnic Institute and State University carried out a study to determine if there is a significant difference in the density of organisms in two different stations located in Cedar Run, a secondary river that is located in the river basin. Roanoke. Drainage from a sewage treatment plant and overflow from the Federal Mogul Corporation sedimentation pond enter the flow near the source of the river. The following data give the density measurements, in numbers of organisms per square meter, at the two different collecting stations. Number of organisms per square meter Station 1 Station 2 5030 2800 13700 4670 10730 6890 11400 7720 860 7030 2200 7330 4250 2810 15040 1330 4980 3320 11910 1230 8130 2130 26850 2190 17660 22800 1130 1690 With a significance level of 0.05, can we conclude that the densities are the same in the two…arrow_forward
- 1. Order: Colace Syrup 20 mL Label: Colace Syrup (docusate sodium) 20 mg per tsp (teaspoon) Use dimensional analysis to determine how many tsp will the patient need based on this order. 2. The order is for Zosyn 1.3 g to be infused in 100 mL D5W (dextrose 5 % in water) over a period of 30 minutes (the drop factor is 60 gtt/mL). Use dimensional analysis to determine the flow rate for this infusion in mg per min (mg/min).arrow_forward5. The local aquaritum is repurposing a large occan exchibit into a prescutation of estuaries. The tank bolds 10.000 aallons of water. The current ocean exhibit contains 2800 pounds of salt. The desired concentration for the new exhibit is 0.1 pounls per galkon. Fresh water will be adled to the tank at a coustant rate of 10 gallous per minutle. The solution in the tank immediately mixes thoronghly and drains at a rate of 10 gallons per mimte. a. Wrile lhe diflerenulial equatini ansl initial conuditions represenilmng ilhe anenail of sall, S, in the lank. Dis nol solve dr h. Salve the differential equation you kumd in part a. Your linal equation should be an equation for S in tenns of * (in minutes).arrow_forwardMvsarrow_forward
- A new process for producing synthetic diamonds can be operated at a profitable level only if the average weight of the diamonds is greater than 0.5 karat. To evaluate the profitability of the process, six diamonds are generated, with recorded weights 0.46, 0.61, 0.52, 0.48, 0.57 and o.54 karat. Do the six measurements present sufficient evidence to indicate that the average weight of the diamonds produced by the process is in excess of 0.5 karat? Use 5% level of significancearrow_forwardThe Table below represents volume and trip cost data from which you are asked to determine the following: d) Volume of drivers paying the optimum toll Value of Trip Average Volume (vph) | to Last Driver Vehicle Trip Entering ($) Traffic Cost to all vehicles by the last driver entering the highway ($) Cost ($) 2725 6.06 4.00 0.00 3000 5.75 4.00 0.00 3250 5.44 4.07 0.09 3500 5.13 4.18 0.25 3750 4.82 4.32 0.50 4000 4.5 4.50 0.80 4250 4.19 4.72 1.19arrow_forwardThe quality control engineer at Palmer Industries is interested in estimating the tensile strength of steel wire based on its outside diameter and the amount of molybdenum in the steel. As an experiment, she selected 25 pieces of wire, measured the outside diameters, and determined the molybdenum content. Then she measured the tensile strength of each piece. The results of the first four are recorded in the table. Tensile Strength Outside Diameter Amount of Molybdenum Place (PSI ) Y (mm) X1 (Units) X2 A 11 0.3 6 B 9 0.2 5 C 16 0.4 8 D 12 0.3 7 Using a statistical software package, the QC engineer determined the multiple regression equation to be Y’=-0.5+20X1+1X2. a) Based on the equation, what is the estimated tensile strength of a steel wire having an outside diameter of .35 mm and 6.4 units of molybdenum? b) Interpret the value of b1 in the equation.arrow_forward
arrow_back_ios
SEE MORE QUESTIONS
arrow_forward_ios
Recommended textbooks for you
- MATLAB: An Introduction with ApplicationsStatisticsISBN:9781119256830Author:Amos GilatPublisher:John Wiley & Sons Inc
 Probability and Statistics for Engineering and th...StatisticsISBN:9781305251809Author:Jay L. DevorePublisher:Cengage Learning
 Statistics for The Behavioral Sciences (MindTap C...StatisticsISBN:9781305504912Author:Frederick J Gravetter, Larry B. WallnauPublisher:Cengage Learning
  Elementary Statistics: Picturing the World (7th E...StatisticsISBN:9780134683416Author:Ron Larson, Betsy FarberPublisher:PEARSON
 The Basic Practice of StatisticsStatisticsISBN:9781319042578Author:David S. Moore, William I. Notz, Michael A. FlignerPublisher:W. H. Freeman
 Introduction to the Practice of StatisticsStatisticsISBN:9781319013387Author:David S. Moore, George P. McCabe, Bruce A. CraigPublisher:W. H. Freeman
MATLAB: An Introduction with Applications
Statistics
ISBN:9781119256830
Author:Amos Gilat
Publisher:John Wiley & Sons Inc
Probability and Statistics for Engineering and th...
Statistics
ISBN:9781305251809
Author:Jay L. Devore
Publisher:Cengage Learning
Statistics for The Behavioral Sciences (MindTap C...
Statistics
ISBN:9781305504912
Author:Frederick J Gravetter, Larry B. Wallnau
Publisher:Cengage Learning
Elementary Statistics: Picturing the World (7th E...
Statistics
ISBN:9780134683416
Author:Ron Larson, Betsy Farber
Publisher:PEARSON
The Basic Practice of Statistics
Statistics
ISBN:9781319042578
Author:David S. Moore, William I. Notz, Michael A. Fligner
Publisher:W. H. Freeman
Introduction to the Practice of Statistics
Statistics
ISBN:9781319013387
Author:David S. Moore, George P. McCabe, Bruce A. Craig
Publisher:W. H. Freeman