
MATLAB: An Introduction with Applications
6th Edition
ISBN: 9781119256830
Author: Amos Gilat
Publisher: John Wiley & Sons Inc
expand_more
expand_more
format_list_bulleted
Related questions
Question
thumb_up100%
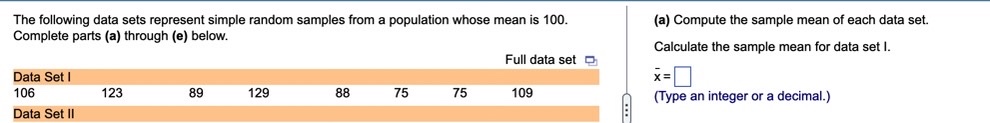

Transcribed Image Text:The following data sets represent simple random samples from a population whose mean is 100.
Complete parts (a) through (e) below.
Full data set O
Data Set I
106
123
89
129
88
75
75
109
Data Set II
(a) Compute the sample mean of each data set.
Calculate the sample mean for data set I.
x=
(Type an integer or a decimal.)

Transcribed Image Text:Data Set I
106
Data Set II
106
85
100
Data Set III
106
85
100
105
123
123
90
84
123
90
84
77
89
109
82
89
109
82
85
89
129
129
89
104
129
89
104
109
88
88
114
88
114
91
92
75
75
114
75
114
113
119
75
75
95
75
95
119
Full data set
109
109
119
109
119
89
Expert Solution
This question has been solved!
Explore an expertly crafted, step-by-step solution for a thorough understanding of key concepts.

This is a popular solution

Trending nowThis is a popular solution!

Step by stepSolved in 2 steps with 1 images

Knowledge Booster

Similar questions
- Consider the following data set: i X 1 -4 23410 5 -2 0 2 4 Y₁ -10.672 -6.428 -2.242 1.946 7.596arrow_forwardnsider the following data representing the price of plasma televisions (in dollars). 1260, 1355, 1156, 1297, 1054, 1225, 1375, 1244, 1281, 1138, 1368, 1075, 1373, 1126, 1067, 1285, 1119, 1209, 1150, 1208, 1284 Class 1034-1093 1094-1153 1154-1213 1214-1273 1274-1333 1334-1393 Frequency Price of Plasma Televisions (in Dollars) Class Boundaries Midpoint Relative Frequency Step 4 of 7: Determine the upper class boundary for the sixth class. Copy Data Cumulative Frequencyarrow_forwardWhat is the mean and median of the data represented in this Stem and Leaf Display? Round answers to 1 decimal. Stem Leaves 1 6667 2359 3 0011 mean = 23.1 and median = 25.0 mean = 24.5 and median = 25.0 mean = 24.0 and median = 24.0 %3D mean = 23.8 and median = 24.0arrow_forward
- Consider the following data set: 2, 3, 4, 5, 7, 8, 8, 9, 10, 12, 13 What is the interquartile range of this set of data? Select one: a. 6. O b. 3 Od. 5arrow_forwardConsider the following data consisting of 9 values: Data 3 20 12 0 16 5 19 4 8 The minimum is The first quartile is The median is The third quartile is The maximum is The IQR isarrow_forwardFind the mean of the data summarized in the given frequency distribution. Compare the computed mean to the actual mean of 51.6 miles per hour. Speed (miles per hour) Frequency 42 - 45 46 - 49 50 - 53 54 – 57 58 – 61 22 13 3 The mean of the frequency distribution is miles per hour. (Round to the nearest tenth as needed.)arrow_forward
- Construct a frequency distribution for the given data set using 6 classes. In the table, include the midpoints, relative frequencies, and cumulative frequencies. Which class has the greatest frequency and which has the least frequency? Amount (in dollars) spent on books for a semester 199 456 267 490 209 529 159 171 381 241 272 42 517 193 0 100arrow_forwardFind the five-number summary for the following set of data. Data 2 7 9 10 12 12 16 17 21 21 25 Min=Q1= Q2= Q3= Max=arrow_forwardA local store owner is interested in finding the mean age of her customers. She randomly surveys 82 customers and records their age. Identify the population, sample, variable, type of variable, parameter, and statistic.arrow_forward
- Here is a set of data. 115 224 294 364 439 588 634 639 695 743 778 844 Identify the 5 number summary (min, Q1, median, Q3, max)arrow_forwardHere is a set of data. 66 105 119 230 240 365 456 507 620 704 742 871 944 964 Identify the 5 number summary (min, Q1, median, Q3, max)arrow_forwardToday, all boats in the Harbor Tour Fishing Company caught a total of six salmon with weights as follows in pounds: 16, 23, 18, 31, 14, and 19. Calculate the mean (show the appropriate formula) the median (use the median location formula; interpret the medial weight) and the mode. Is the mean here a statistic or parameter? Explainarrow_forward
arrow_back_ios
SEE MORE QUESTIONS
arrow_forward_ios
Recommended textbooks for you
- MATLAB: An Introduction with ApplicationsStatisticsISBN:9781119256830Author:Amos GilatPublisher:John Wiley & Sons Inc
 Probability and Statistics for Engineering and th...StatisticsISBN:9781305251809Author:Jay L. DevorePublisher:Cengage Learning
 Statistics for The Behavioral Sciences (MindTap C...StatisticsISBN:9781305504912Author:Frederick J Gravetter, Larry B. WallnauPublisher:Cengage Learning
  Elementary Statistics: Picturing the World (7th E...StatisticsISBN:9780134683416Author:Ron Larson, Betsy FarberPublisher:PEARSON
 The Basic Practice of StatisticsStatisticsISBN:9781319042578Author:David S. Moore, William I. Notz, Michael A. FlignerPublisher:W. H. Freeman
 Introduction to the Practice of StatisticsStatisticsISBN:9781319013387Author:David S. Moore, George P. McCabe, Bruce A. CraigPublisher:W. H. Freeman
MATLAB: An Introduction with Applications
Statistics
ISBN:9781119256830
Author:Amos Gilat
Publisher:John Wiley & Sons Inc
Probability and Statistics for Engineering and th...
Statistics
ISBN:9781305251809
Author:Jay L. Devore
Publisher:Cengage Learning
Statistics for The Behavioral Sciences (MindTap C...
Statistics
ISBN:9781305504912
Author:Frederick J Gravetter, Larry B. Wallnau
Publisher:Cengage Learning
Elementary Statistics: Picturing the World (7th E...
Statistics
ISBN:9780134683416
Author:Ron Larson, Betsy Farber
Publisher:PEARSON
The Basic Practice of Statistics
Statistics
ISBN:9781319042578
Author:David S. Moore, William I. Notz, Michael A. Fligner
Publisher:W. H. Freeman
Introduction to the Practice of Statistics
Statistics
ISBN:9781319013387
Author:David S. Moore, George P. McCabe, Bruce A. Craig
Publisher:W. H. Freeman