
MATLAB: An Introduction with Applications
6th Edition
ISBN: 9781119256830
Author: Amos Gilat
Publisher: John Wiley & Sons Inc
expand_more
expand_more
format_list_bulleted
Related questions
Concept explainers
Topic Video
Question
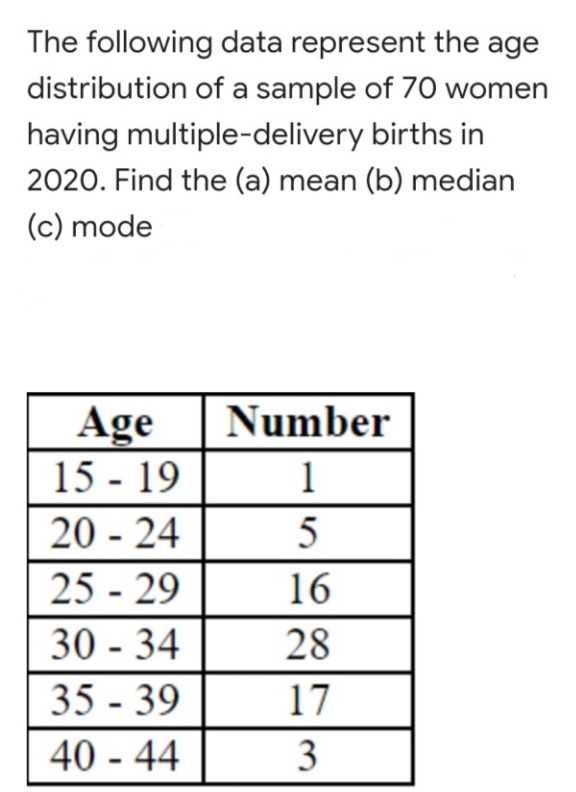

Transcribed Image Text:The following data represent the age
distribution of a sample of 70 women
having multiple-delivery births in
2020. Find the (a) mean (b) median
(c) mode
Age
15 - 19
Number
1
20 - 24
5
25 - 29
16
30 - 34
28
35 - 39
40 - 44
17
3
Expert Solution
This question has been solved!
Explore an expertly crafted, step-by-step solution for a thorough understanding of key concepts.

This is a popular solution

Trending nowThis is a popular solution!

Step by stepSolved in 4 steps

Knowledge Booster


Learn more about
Need a deep-dive on the concept behind this application? Look no further. Learn more about this topic, statistics and related others by exploring similar questions and additional content below.Similar questions
- CORRI Is there a correlation between hours slept and performance on Dr. Corvers Statistics exam? Please calculate both R and interpret. IS THERE A CORRELATION? DO ALL STEPS AND CALCULATIONS THAT YOU WERE SHOWN IN CLASS Hours Slept (X) Number of Items missed on the final exam(Y) 9. 10 9 1 11 1arrow_forwardc. What is the likelihood of selecting a sample with a mean of at least $139,000? Note: Round your value to 2 decimal places and final answer to 4 decimal places. Probability d. What is the likelihood of selecting a sample with a mean of more than $127,000? Note: Round your value to 2 decimal places and final answer to 4 decimal places. Probability e. Find the likelihood of selecting a sample with a mean of more than $127,000 but less than $139,000. Note: Round your z-value to 2 decimal places and final answer to 4 decimal placesarrow_forwardJason collects information about annual family income from each student at his college. He computes both the mean and median family income across all students and is surprised to find that the mean income is much higher than the median income. What is the most likely reason for the difference in the mean and the median? Select one: a. The sample size is too small. b. The median tends to produce lower estimates of central tendency. c. The median is not an appropriate estimate for annual family income's level of measurement. Incorrect d. The mean is more affected by a small number of extreme values.arrow_forward
- The following data shows the cost of electricity (in $) during July 2015 for a random sample of 50 one-bedroom apartments in a large city. a.Form a frequency distribution for the above data. b. Find arithmetic mean based on the frequency distribution you developed.arrow_forwardA survey has been conducted recently to study the hourly wages of part-time employees at the Food Delivery services sector. The result was organized into the following frequency distribution. Hourly Wages Number of Part-time Employees $40 − less than $50 12 $50 − less than $60 26 $60 − less than $70 35 $70 − less than $80 17 $80 − less than $90 8 $90 − less than $100 2 (i) Calculate the mean, mode and standard deviation of the hourly wages. (ii) Calculate the coefficient of variation. (iii) If the median is equal to 64, calculate Pearson’s 2nd coefficient of skewness and interpret your answer briefly. (iv) The government wants to carry out similar survey next year. If the error of a point estimate of the mean is not more than $1.5, use the 97% confidence level to determine the sample size required to achieve this error.arrow_forwardStudents in an experimental psychology class did research on depression as a sign of stress. A test was administered to a sample of 30 students. The scores are given. Complete parts (a) through (c) below. 32 54 11 15 35 21 OA. 158 34 15 55 51 11 35 2 1457 3 1234567 4123445566 511245666 34 33 46 OB. 11155 (a) Find the mean and median of the data. The mean is . (Round to three decimal places as needed.) 44 26 27 The median is .(Type an integer or a decimal.) (b) Draw a stem-and-leaf plot for the data using one row per stem. Which stem-and-leaf plot below shows the data? 2 112677 3 233445556 4 244666 5 1456 ... 21 42 38 OA. The distribution is symmetric. B. The distribution is skewed right (positively skewed). OC. The distribution is skewed left (negatively skewed). O D. The distribution is uniform. (c) Describe the shape of the distribution. Which description below best describes the shape of the distribution? 56 46 OC. 1112455668 2 14556 3 15 4 13457 5 223446667 46 27 33 35 22 44 36 0…arrow_forward
- The following table displays the ages of female actors when they starred in their award-winning performances. Ages of Female Award Recipients 40 41 35 33 29 27 30 34 29 74 35 28 32 45 61 49 49 32 37 39 33 60 33 45 21 27 67 42 26 26 25 34 45 81 36 54 Find the mean and the median for the data in the table. (Round your mean to one decimal place.) mean medianarrow_forwardThe durations (minutes) of 26 electric power outages in the community of Sonando Heights over the past five years are shown below. 36 49 23 68 26 12 54 13 50 4 14 42 42 101 31 18 13 51 22 3 17 26 91 25 13 20 Click here for the Excel Data File (a) Find the mean, median, and mode. (Round your answers to 2 decimal places.)arrow_forward
arrow_back_ios
arrow_forward_ios
Recommended textbooks for you
- MATLAB: An Introduction with ApplicationsStatisticsISBN:9781119256830Author:Amos GilatPublisher:John Wiley & Sons Inc
 Probability and Statistics for Engineering and th...StatisticsISBN:9781305251809Author:Jay L. DevorePublisher:Cengage Learning
 Statistics for The Behavioral Sciences (MindTap C...StatisticsISBN:9781305504912Author:Frederick J Gravetter, Larry B. WallnauPublisher:Cengage Learning
  Elementary Statistics: Picturing the World (7th E...StatisticsISBN:9780134683416Author:Ron Larson, Betsy FarberPublisher:PEARSON
 The Basic Practice of StatisticsStatisticsISBN:9781319042578Author:David S. Moore, William I. Notz, Michael A. FlignerPublisher:W. H. Freeman
 Introduction to the Practice of StatisticsStatisticsISBN:9781319013387Author:David S. Moore, George P. McCabe, Bruce A. CraigPublisher:W. H. Freeman
MATLAB: An Introduction with Applications
Statistics
ISBN:9781119256830
Author:Amos Gilat
Publisher:John Wiley & Sons Inc
Probability and Statistics for Engineering and th...
Statistics
ISBN:9781305251809
Author:Jay L. Devore
Publisher:Cengage Learning
Statistics for The Behavioral Sciences (MindTap C...
Statistics
ISBN:9781305504912
Author:Frederick J Gravetter, Larry B. Wallnau
Publisher:Cengage Learning
Elementary Statistics: Picturing the World (7th E...
Statistics
ISBN:9780134683416
Author:Ron Larson, Betsy Farber
Publisher:PEARSON
The Basic Practice of Statistics
Statistics
ISBN:9781319042578
Author:David S. Moore, William I. Notz, Michael A. Fligner
Publisher:W. H. Freeman
Introduction to the Practice of Statistics
Statistics
ISBN:9781319013387
Author:David S. Moore, George P. McCabe, Bruce A. Craig
Publisher:W. H. Freeman