
MATLAB: An Introduction with Applications
6th Edition
ISBN: 9781119256830
Author: Amos Gilat
Publisher: John Wiley & Sons Inc
expand_more
expand_more
format_list_bulleted
Related questions
Question
thumb_up100%
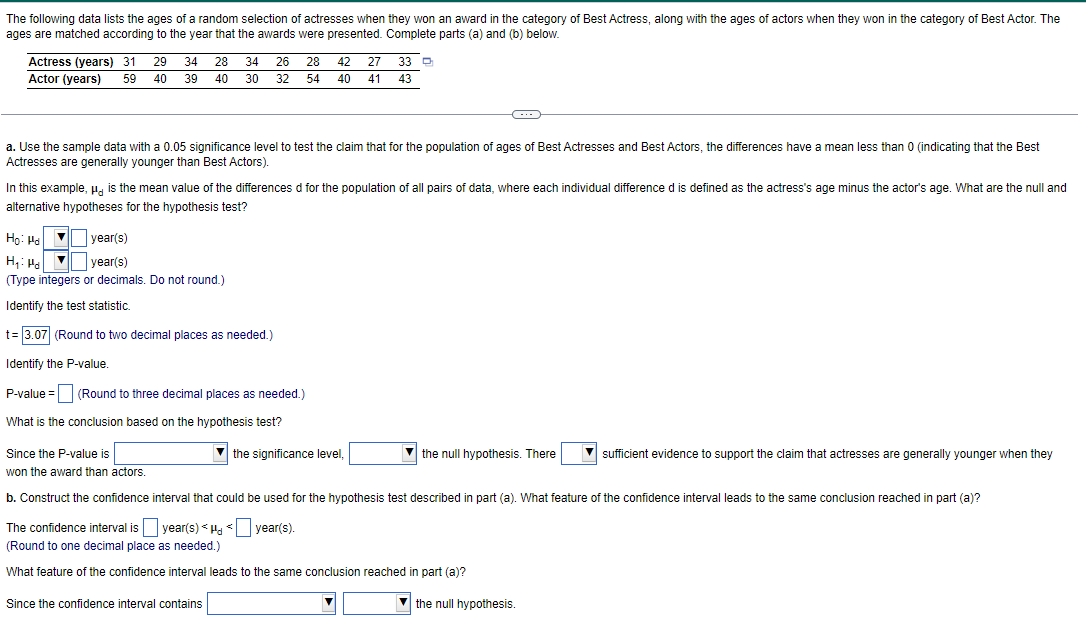

Transcribed Image Text:The following data lists the ages of a random selection of actresses when they won an award in the category of Best Actress, along with the ages of actors when they won in the category of Best Actor. The
ages are matched according to the year that the awards were presented. Complete parts (a) and (b) below.
Actress (years) 31 29 34 28 34 26 28
Actor (years) 59 40 39 40 30 32 54
a. Use the sample data with a 0.05 significance level to test the claim that for the population of ages of Best Actresses and Best Actors, the differences have a mean less than 0 (indicating that the Best
Actresses are generally younger than Best Actors).
In this example, is the mean value of the differences d for the population of all pairs of data, where each individual difference d is defined as the actress's age minus the actor's age. What are the null and
alternative hypotheses for the hypothesis test?
Ho: Ho
Md
42 27 33
40 41 43
year(s)
year(s)
H₁ H
(Type integers or decimals. Do not round.)
Identify the test statistic.
t = 3.07 (Round to two decimal places as needed.)
Identify the P-value.
P-value =
(Round to three decimal places as needed.)
What is the conclusion based on the hypothesis test?
the significance level,
Since the P-value is
won the award than actors.
b. Construct the confidence interval that could be used for the hypothesis test described in part (a). What feature of the confidence interval leads to the same conclusion reached in part (a)?
The confidence interval is year(s) < d <
year(s).
(Round to one decimal place as needed.)
What feature of the confidence interval leads to the same conclusion reached in part (a)?
Since the confidence interval contains
the null hypothesis. There
the null hypothesis.
sufficient evidence to support the claim that actresses are generally younger when they
Expert Solution
This question has been solved!
Explore an expertly crafted, step-by-step solution for a thorough understanding of key concepts.

This is a popular solution

Trending nowThis is a popular solution!

Step by stepSolved in 5 steps with 28 images

Knowledge Booster

Similar questions
- The heights (to the nearest inch) of 30 males are shown below. Construct a frequency distribution and a frequency histogram of the data using 5 classes. Describe the shape of the histogram as symmetric, uniform, negatively skewed, positively skewed, or none of these. 67 76 70 68 72 68 65 63 76 69 66 72 66 66 69 73 62 62 71 73 70 72 71 65 68 66 74 72 68 69 ... Question content area right Part 1 Construct a frequency distribution of the data using 5 classes. Use the minimum data entry as the lower limit of the first class. Use the smallest whole number class width possible. Class Frequency Midpoint enter your response here –enter your response here enter your response here enter your response here enter your response here –enter your response here enter your response here enter your response here enter your…arrow_forwardThe 2008 general social survey asked a nationally representative sample of 1324 adult americans to report how many hours of television they watch in a typical day. The resulting data are reported in the following table counts. What is the mean numbers of hours of tv watched?arrow_forwardUse the following data, which represent the English placement test scores of a sample of 30 students, to construct a frequency distribution with a first class of 472 – 492. Placement Test Scores Number of Students 472 - 492 529 527 476 532 588 493 – 513 488 494 559 492 483 514 - 534 555 565 519 541 516 574 482 500 474 541 535 – 555 573 543 595 580 488 556 – 576 514 528 488 524 559 577 - 597arrow_forward
- what is the mean of the data set?arrow_forwardHere is a set of sample data. 53 85 72 19 63 80 21 78 79 5 33 23 37 11 31 61 24 2 58 1 28 Base on the data above, identify the 5 number summaryarrow_forwardConsider a sample with data values of 27, 25, 20, 15, 30, 34, 28, and 25. Compute the 19th, 24th, 65th, and 75th percentiles. If needed, round your answers to two decimal digits. Percentile Value 19% 24% 65% 75%arrow_forward
- Here is a set of sample data. 43 75 64 40 50 11 91 99 44 82 39 25 35 86 60 2 27 83 45 65 1 93 88 10 Base on the data above, identify the 5 number summaryarrow_forwardHere is a set of sample data. 76 77 55 35 58 6 25 37 38 85 45 54 98 78 84 31 93 15 88 52 83 7 90 71 60 66 14 17 Base on the data above, identify the 5 number summaryarrow_forwardnumber 23 please :)arrow_forward
- The following data lists the ages of a random selection of actresses when they won an award in the category of Best Actress, along with the ages of actors when they won in the category of Best Actor. The ages are matched according to the year that the awards were presented. Complete parts (a) and (b) below. Actress (years) 27 Actor (years) 61 29 35 28 31 36 39 36 33 25 27 34 47 41 41 31 37 35 D 43 a. Use the sample data with a 0.01 significance level to test the claim that for the population of ages of Best Actresses and Best Actors, the differences have a mean less than 0 (indicating that the Best Actresses are generally younger than Best Actors). In this example, H is the mean value of the differences d for the population of all pairs of data, where each individual difference d is defined as the actress's age minus the actor's age. What are the null and alternative hypotheses for the hypothesis test? Ho Hd= 0 year(s) H₁ Hd< 0 year(s) (Type integers or decimals. Do not round.)…arrow_forwardThe following data lists the ages of a random selection of actresses when they won an award in the category of Best Actress, along with the ages of actors when they won in the category of Best Actor. The ages are matched according to the year that the awards were presented. Complete parts (a) and (b) below. Actress (years) 26 Actor (years) 26 32 28 38 29 29 45 27 31 D 60 37 40 40 28 36 50 35 41 43 a. Use the sample data with a 0.01 significance level to test the claim that for the population of ages of Best Actresses and Best Actors, the differences have a mean less than 0 (indicating that the Best Actresses are generally younger than Best Actors). In this example, Hd is the mean value of the differences d for the population of all pairs of data, where each individual difference d is defined as the actress's age minus the actor's age. What are the null and alternative hypotheses for the hypothesis test? Ho: Ha year(s) year(s) (Type integers or decimals. Do not round.)arrow_forwardHere is a set of sample data. 96 52 19 97 98 67 93 45 57 41 89 60 66 5 42 32 71 73 90 33 53 35 24 85 9 75 Base on the data above, identify the 5 number summary , , , ,arrow_forward
arrow_back_ios
SEE MORE QUESTIONS
arrow_forward_ios
Recommended textbooks for you
- MATLAB: An Introduction with ApplicationsStatisticsISBN:9781119256830Author:Amos GilatPublisher:John Wiley & Sons Inc
 Probability and Statistics for Engineering and th...StatisticsISBN:9781305251809Author:Jay L. DevorePublisher:Cengage Learning
 Statistics for The Behavioral Sciences (MindTap C...StatisticsISBN:9781305504912Author:Frederick J Gravetter, Larry B. WallnauPublisher:Cengage Learning
  Elementary Statistics: Picturing the World (7th E...StatisticsISBN:9780134683416Author:Ron Larson, Betsy FarberPublisher:PEARSON
 The Basic Practice of StatisticsStatisticsISBN:9781319042578Author:David S. Moore, William I. Notz, Michael A. FlignerPublisher:W. H. Freeman
 Introduction to the Practice of StatisticsStatisticsISBN:9781319013387Author:David S. Moore, George P. McCabe, Bruce A. CraigPublisher:W. H. Freeman
MATLAB: An Introduction with Applications
Statistics
ISBN:9781119256830
Author:Amos Gilat
Publisher:John Wiley & Sons Inc
Probability and Statistics for Engineering and th...
Statistics
ISBN:9781305251809
Author:Jay L. Devore
Publisher:Cengage Learning
Statistics for The Behavioral Sciences (MindTap C...
Statistics
ISBN:9781305504912
Author:Frederick J Gravetter, Larry B. Wallnau
Publisher:Cengage Learning
Elementary Statistics: Picturing the World (7th E...
Statistics
ISBN:9780134683416
Author:Ron Larson, Betsy Farber
Publisher:PEARSON
The Basic Practice of Statistics
Statistics
ISBN:9781319042578
Author:David S. Moore, William I. Notz, Michael A. Fligner
Publisher:W. H. Freeman
Introduction to the Practice of Statistics
Statistics
ISBN:9781319013387
Author:David S. Moore, George P. McCabe, Bruce A. Craig
Publisher:W. H. Freeman