
MATLAB: An Introduction with Applications
6th Edition
ISBN: 9781119256830
Author: Amos Gilat
Publisher: John Wiley & Sons Inc
expand_more
expand_more
format_list_bulleted
Related questions
Question
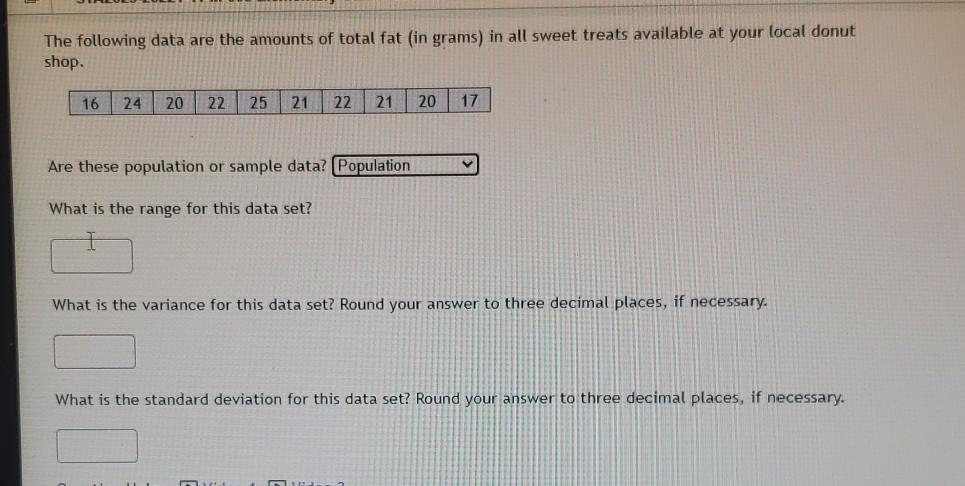

Transcribed Image Text:The following data are the amounts of total fat (in grams) in all sweet treats available at your local donut
shop.
16
24
20
22
25
21
22
21
20
17
Are these population or sample data? (Population
What is the range for this data set?
What is the variance for this data set? Round your answer to three decimal places, if necessary.
What is the standard deviation for this data set? Round your answer to three decimal places, if necessary.
Expert Solution
This question has been solved!
Explore an expertly crafted, step-by-step solution for a thorough understanding of key concepts.

This is a popular solution

Trending nowThis is a popular solution!

Step by stepSolved in 2 steps with 2 images

Knowledge Booster

Similar questions
- ??arrow_forwardPage 2 of 5 B. Organizing and Working with Data. 1. Find the z-score for the weight of a 155-pound woman. The mean weight of woman age 20 or older is 170.6 pounds with a standard deviation of 5.4 pounds. Round your answer to two decimal places.arrow_forward: Which one of the following statements is True? The units of the Variance are the same as the original data. The Mean can be found from a Box Plot. Relative Frequency equals Frequency multiplied by Total Frequency. An Ogive chart increases in height from left to right. For a unimodal mound shaped distribution that is Skewed Left the Mean is greater than the Median.arrow_forward
- For the data shown, answer the questions. Round to 4 decimal places where possible. 17.3 15 28.8 3.6 6.3 10 Find the mean: Find the median: Find the standard deviation:arrow_forwardYou review your data from a population A and population B. The mean and standard deviation are noted as N(mean, standard deviation). NA(400,10) and NB(300,25). 95 percent of the observations for population A exceed a value of___________?95 percent of the observations for population B are less than a value of _____________?arrow_forwardCan someone help me out with these questions.arrow_forward
- Consider the following data: −10, −10, 0, 3, −10, 3, 3 Step 1 of 3: Calculate the value of the sample Variance. Round your answer to one decimal place. Step 2 of 3: Calculate the value of the sample deviation. Round your answer to one decimal place. Step 3 of 3: Calculate the value of the range.arrow_forwardWhat was the age distribution of prehistoric Native Americans? Extensive anthropological studies in the southwestern United States gave the following information about a prehistoric extended family group of 84 members on what is now a Native American reservation. For this community, estimate the mean age expressed in years, the sample variance, and the sample standard deviation. For the ciass 31 and over, use 35.5 as the class midpoint. (Round your answers to one decimal place.) Age range (years) Number of individuals 1-10 11-20 19 21-30 15 31 and over 40 10arrow_forwardThe median for this question.arrow_forward
arrow_back_ios
arrow_forward_ios
Recommended textbooks for you
- MATLAB: An Introduction with ApplicationsStatisticsISBN:9781119256830Author:Amos GilatPublisher:John Wiley & Sons Inc
 Probability and Statistics for Engineering and th...StatisticsISBN:9781305251809Author:Jay L. DevorePublisher:Cengage Learning
 Statistics for The Behavioral Sciences (MindTap C...StatisticsISBN:9781305504912Author:Frederick J Gravetter, Larry B. WallnauPublisher:Cengage Learning
  Elementary Statistics: Picturing the World (7th E...StatisticsISBN:9780134683416Author:Ron Larson, Betsy FarberPublisher:PEARSON
 The Basic Practice of StatisticsStatisticsISBN:9781319042578Author:David S. Moore, William I. Notz, Michael A. FlignerPublisher:W. H. Freeman
 Introduction to the Practice of StatisticsStatisticsISBN:9781319013387Author:David S. Moore, George P. McCabe, Bruce A. CraigPublisher:W. H. Freeman
MATLAB: An Introduction with Applications
Statistics
ISBN:9781119256830
Author:Amos Gilat
Publisher:John Wiley & Sons Inc
Probability and Statistics for Engineering and th...
Statistics
ISBN:9781305251809
Author:Jay L. Devore
Publisher:Cengage Learning
Statistics for The Behavioral Sciences (MindTap C...
Statistics
ISBN:9781305504912
Author:Frederick J Gravetter, Larry B. Wallnau
Publisher:Cengage Learning
Elementary Statistics: Picturing the World (7th E...
Statistics
ISBN:9780134683416
Author:Ron Larson, Betsy Farber
Publisher:PEARSON
The Basic Practice of Statistics
Statistics
ISBN:9781319042578
Author:David S. Moore, William I. Notz, Michael A. Fligner
Publisher:W. H. Freeman
Introduction to the Practice of Statistics
Statistics
ISBN:9781319013387
Author:David S. Moore, George P. McCabe, Bruce A. Craig
Publisher:W. H. Freeman