
MATLAB: An Introduction with Applications
6th Edition
ISBN: 9781119256830
Author: Amos Gilat
Publisher: John Wiley & Sons Inc
expand_more
expand_more
format_list_bulleted
Related questions
Concept explainers
Topic Video
Question
thumb_up100%

Transcribed Image Text:Saved
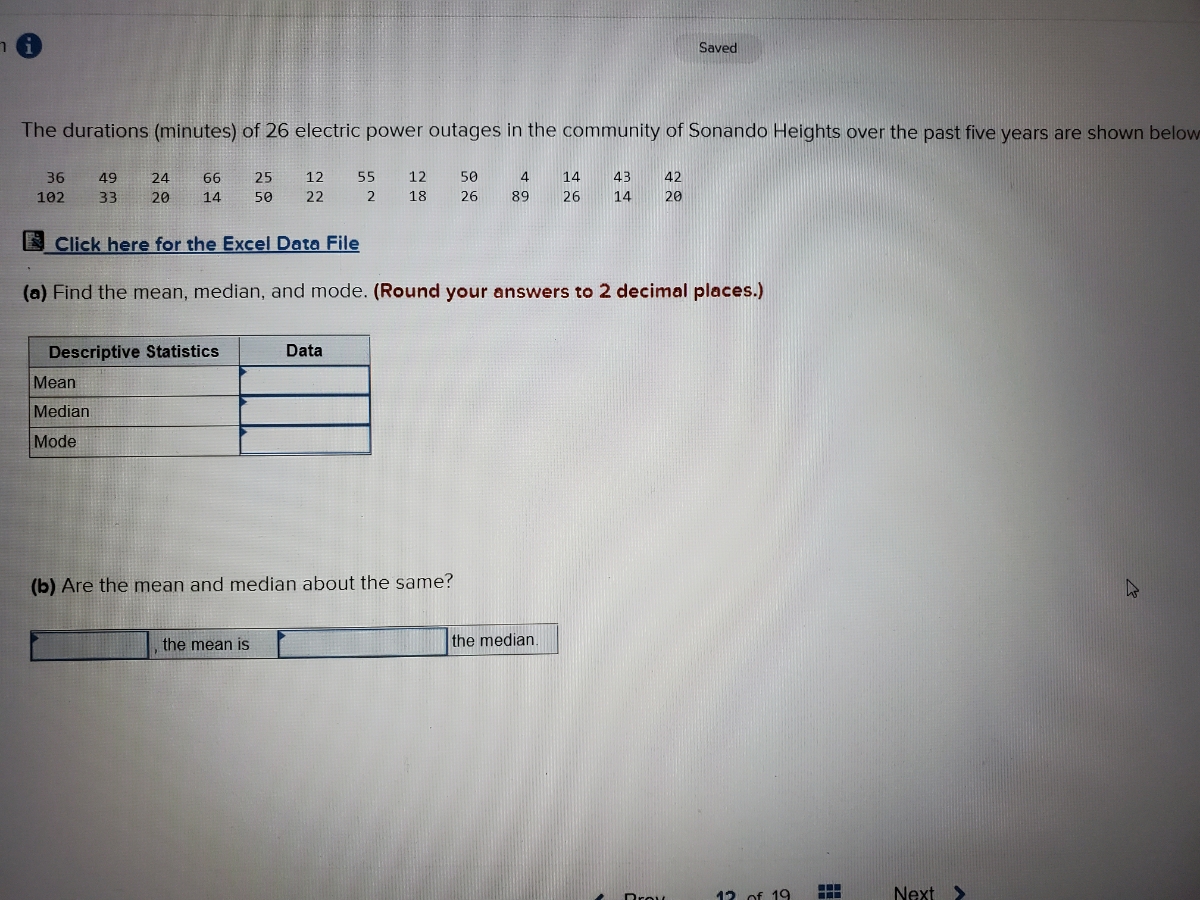
The durations (minutes) of 26 electric power outages in the community of Sonando Heights over the past five years are shown below
36
49
24
66
25
12
55
12
50
4
14
43
42
102
33
20
14
50
22
2
18
26
89
26
14
20
E Click here for the Excel Data File
(a) Find the mean, median, and mode. (Round your answers to 2 decimal places.)
Descriptive Statistics
Data
Mean
Median
Mode
(b) Are the mean and median about the same?
the mean is
the median.
Drou
12 of 19
Next

Transcribed Image Text:am
Saved
Consider the following sample data.
Sample A:
Sample B:
Sample C:
13, 23, 33
71, 81, 91
1,050; 1,060; 1,070
(a) Find the mean and standard deviation for each sample.
Sample A
Sample B
Sample C
Mean
Sample Standard Deviation
(b) What does this exercise show about the standard deviation?
O The idea is to illustrate that the standard deviation is not a function of the value of the mean.
O The idea is to illustrate that the standard deviation is a function of the value of the mean.
Expert Solution
This question has been solved!
Explore an expertly crafted, step-by-step solution for a thorough understanding of key concepts.

Step by stepSolved in 4 steps with 4 images

Knowledge Booster


Learn more about
Need a deep-dive on the concept behind this application? Look no further. Learn more about this topic, statistics and related others by exploring similar questions and additional content below.Similar questions
- please help answer fullyarrow_forwardII On Friday night, the owner of Chez Pierre in downtown Chicago noted the amount spent for dinner for 28 four-person tables. 95 103 109 114 113 107 10 OLT 104 08 134 124 105 84 176 115 69 68 95 108 61 091 87 128 95 61 150 52 136 E Click here for the Excel Data File (a) Find the mean, median, and mode. (Round your answers to 2 decimal places.) Descriptive Statistics Data Count Mean Median Mode (b) Are the data symmetric or skewed? If skewed, which direction? O Symmetric O Skewed left O Skewed right Graw 11!H < Prev 10 of 19 ....... 2 Type here to search < įXƏNarrow_forwardAnswer clearlyarrow_forward
- Find the mean, median, and mode of the set of values. Age (years) 12 Frequency 5 13 9 14 10 15 11 16 7 17 7 18 4arrow_forwardExplain your answers pleasearrow_forwardFind the mean, median, and mode(s) of the data in the following stem-and-leaf plot. The leaf represents the ones digit. 09 1 59 2 6788 1 Part 1 of 3 Find the mean. Round your answer to one decimal place, if necessary. Mean: S Part 2 of 3 Find the median. Round your answer to one decimal place, if necessary. Median: X Sarrow_forward
arrow_back_ios
arrow_forward_ios
Recommended textbooks for you
- MATLAB: An Introduction with ApplicationsStatisticsISBN:9781119256830Author:Amos GilatPublisher:John Wiley & Sons Inc
 Probability and Statistics for Engineering and th...StatisticsISBN:9781305251809Author:Jay L. DevorePublisher:Cengage Learning
 Statistics for The Behavioral Sciences (MindTap C...StatisticsISBN:9781305504912Author:Frederick J Gravetter, Larry B. WallnauPublisher:Cengage Learning
  Elementary Statistics: Picturing the World (7th E...StatisticsISBN:9780134683416Author:Ron Larson, Betsy FarberPublisher:PEARSON
 The Basic Practice of StatisticsStatisticsISBN:9781319042578Author:David S. Moore, William I. Notz, Michael A. FlignerPublisher:W. H. Freeman
 Introduction to the Practice of StatisticsStatisticsISBN:9781319013387Author:David S. Moore, George P. McCabe, Bruce A. CraigPublisher:W. H. Freeman
MATLAB: An Introduction with Applications
Statistics
ISBN:9781119256830
Author:Amos Gilat
Publisher:John Wiley & Sons Inc
Probability and Statistics for Engineering and th...
Statistics
ISBN:9781305251809
Author:Jay L. Devore
Publisher:Cengage Learning
Statistics for The Behavioral Sciences (MindTap C...
Statistics
ISBN:9781305504912
Author:Frederick J Gravetter, Larry B. Wallnau
Publisher:Cengage Learning
Elementary Statistics: Picturing the World (7th E...
Statistics
ISBN:9780134683416
Author:Ron Larson, Betsy Farber
Publisher:PEARSON
The Basic Practice of Statistics
Statistics
ISBN:9781319042578
Author:David S. Moore, William I. Notz, Michael A. Fligner
Publisher:W. H. Freeman
Introduction to the Practice of Statistics
Statistics
ISBN:9781319013387
Author:David S. Moore, George P. McCabe, Bruce A. Craig
Publisher:W. H. Freeman