
MATLAB: An Introduction with Applications
6th Edition
ISBN: 9781119256830
Author: Amos Gilat
Publisher: John Wiley & Sons Inc
expand_more
expand_more
format_list_bulleted
Related questions
Question
Find the quantity (deviance) for testing the hypothesis ?0H0 that data supports the glm fit against the alternative ?1H1 that data supports the maximal model.
B) the degrees of freedom and pvalue for testing H0
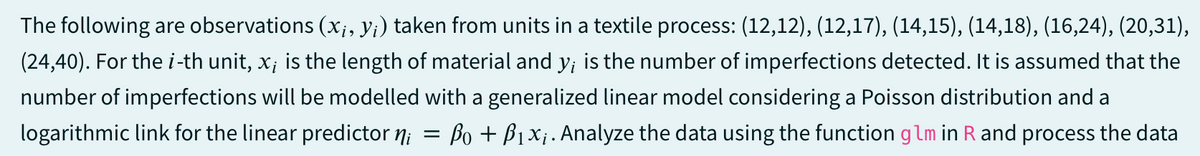

Transcribed Image Text:The following are observations (x¡, y¡) taken from units in a textile process: (12,12), (12,17), (14,15), (14,18), (16,24), (20,31),
(24,40). For the i-th unit, x; is the length of material and y; is the number of imperfections detected. It is assumed that the
number of imperfections will be modelled with a generalized linear model considering a Poisson distribution and a
logarithmic link for the linear predictor ni
=
Po + B₁x₁. Analyze the data using the function glm in R and process the data
Expert Solution
This question has been solved!
Explore an expertly crafted, step-by-step solution for a thorough understanding of key concepts.

Step by stepSolved in 3 steps with 8 images

Knowledge Booster

Similar questions
- The graph portrays the decision criterion for a hypothesis test for a population mean. The null hypothesis is H,: u=Hn. The curve is the normal curve for the test statistic under the assumption that the null hypothesis is true. Use the graph to solve the problem. A graphical display of the decision criterion follows. Reject H, Do not reject H, Reject H, 3. 0.01 10.01 -2.326 2.326 Determine the critical value(s). O-2326, 2.326 O All z-scores that lie between -2.326, 2.326 02326 0-2326arrow_forwardF25 In 201347% indicated that 31 of business owners gave a holiday gift to their employees. A 2014 survey of 33 business owners % plan to provide a holiday gift to their employees. Is there reason to believe the proportion , of business owners providing gifts has decreased at a-0.005? (See exercise 40 on page 418 of your textbook for a similar problem.) For the hypothesis stated above... Question 1What is/are the critical value(s)? Question 2 What is the test statistic? Question 3 What is the conclusion?arrow_forwardQ5: Rank the data and use the Mann-Whitney U-test to solve for U2. Round your answer to 1 decimal placearrow_forward
arrow_back_ios
arrow_forward_ios
Recommended textbooks for you
- MATLAB: An Introduction with ApplicationsStatisticsISBN:9781119256830Author:Amos GilatPublisher:John Wiley & Sons Inc
 Probability and Statistics for Engineering and th...StatisticsISBN:9781305251809Author:Jay L. DevorePublisher:Cengage Learning
 Statistics for The Behavioral Sciences (MindTap C...StatisticsISBN:9781305504912Author:Frederick J Gravetter, Larry B. WallnauPublisher:Cengage Learning
  Elementary Statistics: Picturing the World (7th E...StatisticsISBN:9780134683416Author:Ron Larson, Betsy FarberPublisher:PEARSON
 The Basic Practice of StatisticsStatisticsISBN:9781319042578Author:David S. Moore, William I. Notz, Michael A. FlignerPublisher:W. H. Freeman
 Introduction to the Practice of StatisticsStatisticsISBN:9781319013387Author:David S. Moore, George P. McCabe, Bruce A. CraigPublisher:W. H. Freeman
MATLAB: An Introduction with Applications
Statistics
ISBN:9781119256830
Author:Amos Gilat
Publisher:John Wiley & Sons Inc
Probability and Statistics for Engineering and th...
Statistics
ISBN:9781305251809
Author:Jay L. Devore
Publisher:Cengage Learning
Statistics for The Behavioral Sciences (MindTap C...
Statistics
ISBN:9781305504912
Author:Frederick J Gravetter, Larry B. Wallnau
Publisher:Cengage Learning
Elementary Statistics: Picturing the World (7th E...
Statistics
ISBN:9780134683416
Author:Ron Larson, Betsy Farber
Publisher:PEARSON
The Basic Practice of Statistics
Statistics
ISBN:9781319042578
Author:David S. Moore, William I. Notz, Michael A. Fligner
Publisher:W. H. Freeman
Introduction to the Practice of Statistics
Statistics
ISBN:9781319013387
Author:David S. Moore, George P. McCabe, Bruce A. Craig
Publisher:W. H. Freeman