MATLAB: An Introduction with Applications
6th Edition
ISBN: 9781119256830
Author: Amos Gilat
Publisher: John Wiley & Sons Inc
expand_more
expand_more
format_list_bulleted
Question
The test is not a t-test it's a different one but I forgot which one was it

Transcribed Image Text:Scenario 3
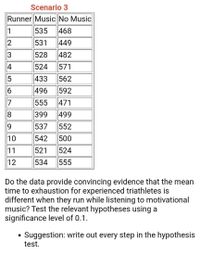
Runner Music No Music
1
535
468
2
531
449
528
482
4
524
571
433
562
496
592
7
555
471
8
399
499
537
552
10
542
500
11
521
524
12
534
555
Do the data provide convincing evidence that the mean
time to exhaustion for experienced triathletes is
different when they run while listening to motivational
music? Test the relevant hypotheses using a
significance level of 0.1.
Suggestion: write out every step in the hypothesis
test.
3.
6.

Transcribed Image Text:Scenario 3
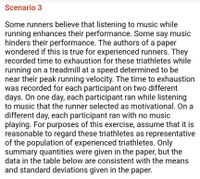
Some runners believe that listening to music while
running enhances their performance. Some say music
hinders their performance. The authors of a paper
wondered if this is true for experienced runners. They
recorded time to exhaustion for these triathletes while
running on a treadmill at a speed determined to be
near their peak running velocity. The time to exhaustion
was recorded for each participant on two different
days. On one day, each participant ran while listening
to music that the runner selected as motivational. On a
different day, each participant ran with no music
playing. For purposes of this exercise, assume that it is
reasonable to regard these triathletes as representative
of the population of experienced triathletes. Only
summary quantities were given in the paper, but the
data in the table below are consistent with the means
and standard deviations given in the paper.
Expert Solution
This question has been solved!
Explore an expertly crafted, step-by-step solution for a thorough understanding of key concepts.
This is a popular solution
Trending nowThis is a popular solution!
Step by stepSolved in 4 steps with 3 images

Knowledge Booster
Similar questions
- The table below shows the marks out of 40 for nine students on two tests. The tests cover similar content but on one test the students are allowed to use a calculator while on the other test calculators are not allowed. Student A B Calculator allowed (x) 8 10 Non-calculator (y) 12 14 (b) C 14 6 Student J scored 25 on the test with calculators allowed, but missed the non-calculator test. Use the marks for students A to I to find the value of the Pearson correlation coefficient between the marks x on the test with calculator allowed and the marks y on the non-calculator test, and the equation of the least squares regression line of y on x. (a) (c) D E F G H I 14 16 22 28 32 36 4 28 16 24 22 18 Use the least squares regression line of y on x to estimate the mark of student J on the non-calculator test. Describe the strength of the correlation between the marks on the two tests and explain how this may affect the accuracy of your estimate.arrow_forwardWhy does the use of multiple t tests increases?arrow_forwardThe low temperatures in the Town of Rigby for 5 conservative days were -12, -17,-11,-12,-18 what was the mean low temperature for five daysarrow_forward
- what are some tips to study for the FSA test like the reading and math as well.arrow_forwardThomas scored at the 45th percentile on the midterm. Which interpretation of his score is the best? Group of answer choices 45% of the people tested exceeded his score. Thomas had a better score than 45% of the people tested. Thomas got 45% of the items correct. More than one of the above is appropriate.arrow_forwardYou want to determine if there is a difference in the number of times statistics students get asked out on dates compared to biology students. You randomly survey four statistics students and four biology students. Data are listed on the table. Statistics Biology students studentsX Y8 144 108 64 10Conduct an independent t-test to see if there is a significant difference. (Be sure to complete all 4 steps.)arrow_forward
- Please teach me on how to solve this problem. C is wrong, maybe B, because it's talking about "sample ", and definitely "36students " are just samples, not population. Thanks so much.arrow_forwardPLEASE HELP SOLVE THE PROBLEM BELOW A candy manufacturer selects mints at random from the production line and weighs them. For one week, the day shift weighed n1 = 194 mints and the night shift weighed n2 = 162 mints. The numbers of these mints that weighed at most 21 grams was y1 = 28 for the day shift and y2 = 11 for the night shift. Let p1 and p2 denote the proportions of mints that weigh at most 21 grams for the day and night shifts, respectively. Give a point estimate of p1 Give the 95% confidence interval for p1 Give a point estimate of p1 − p2 Find the 95% confidence interval for p1 − p2arrow_forward
arrow_back_ios
arrow_forward_ios
Recommended textbooks for you
 MATLAB: An Introduction with ApplicationsStatisticsISBN:9781119256830Author:Amos GilatPublisher:John Wiley & Sons Inc
 Probability and Statistics for Engineering and th...StatisticsISBN:9781305251809Author:Jay L. DevorePublisher:Cengage Learning
 Statistics for The Behavioral Sciences (MindTap C...StatisticsISBN:9781305504912Author:Frederick J Gravetter, Larry B. WallnauPublisher:Cengage Learning
 Elementary Statistics: Picturing the World (7th E...StatisticsISBN:9780134683416Author:Ron Larson, Betsy FarberPublisher:PEARSON
 The Basic Practice of StatisticsStatisticsISBN:9781319042578Author:David S. Moore, William I. Notz, Michael A. FlignerPublisher:W. H. Freeman
 Introduction to the Practice of StatisticsStatisticsISBN:9781319013387Author:David S. Moore, George P. McCabe, Bruce A. CraigPublisher:W. H. Freeman

MATLAB: An Introduction with Applications
Statistics
ISBN:9781119256830
Author:Amos Gilat
Publisher:John Wiley & Sons Inc

Probability and Statistics for Engineering and th...
Statistics
ISBN:9781305251809
Author:Jay L. Devore
Publisher:Cengage Learning

Statistics for The Behavioral Sciences (MindTap C...
Statistics
ISBN:9781305504912
Author:Frederick J Gravetter, Larry B. Wallnau
Publisher:Cengage Learning

Elementary Statistics: Picturing the World (7th E...
Statistics
ISBN:9780134683416
Author:Ron Larson, Betsy Farber
Publisher:PEARSON

The Basic Practice of Statistics
Statistics
ISBN:9781319042578
Author:David S. Moore, William I. Notz, Michael A. Fligner
Publisher:W. H. Freeman

Introduction to the Practice of Statistics
Statistics
ISBN:9781319013387
Author:David S. Moore, George P. McCabe, Bruce A. Craig
Publisher:W. H. Freeman