MATLAB: An Introduction with Applications
6th Edition
ISBN: 9781119256830
Author: Amos Gilat
Publisher: John Wiley & Sons Inc
expand_more
expand_more
format_list_bulleted
Concept explainers
Question

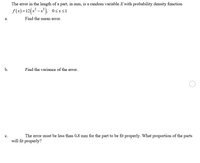
Transcribed Image Text:The error in the length of a part, in mm, is a random variable X with probability density function
f(x)=12(x² -x³), 0sxs1
а.
Find the mean error.
b.
Find the variance of the error.
The error must be less than 0.8 mm for the part to be fit properly. What proportion of the parts
will fit properly?
с.
Expert Solution
This question has been solved!
Explore an expertly crafted, step-by-step solution for a thorough understanding of key concepts.
Step by stepSolved in 2 steps

Knowledge Booster
Learn more about
Need a deep-dive on the concept behind this application? Look no further. Learn more about this topic, statistics and related others by exploring similar questions and additional content below.Similar questions
- for simulation use R codearrow_forwardLet x = red blood cell (RBC) count in millions per cubic millimeter of whole blood. For healthy females, x has an approximately normal distribution with mean u = 4.3 and standard deviation a = 0.5. The Standard Normal Distribution (-0, 0-1) -3 -2 -1 0 68% of area 95% of area 99.7% of area 2 3 Z (a) Convert the x interval, 4.5 < (d) Convert the z interval, z < -1.44, to an x interval. (Round your answer to one decimal place.) x < (e) Convert the z interval, 1.28arrow_forwardThe length of time, in minutes, for an airplane to obtain clearance for takeoff at a certain airport is a random variable Y = 3X- 5, where X has the following density function. Find the mean and variance of the random variable Y. 2 x>0 e f(x) = { 2 0, XS0 ...... The mean of Y is (Type an integer or a fraction.)arrow_forwardlet X and Y are two random variables with p.d.f as f(x,y)=3x2y+3yx2 0<x<1 0<x<1.find conditional density of X given Y?.Find mean mode and standard deviation of r.v Y?. Correlation between X and Y?. check that X and Y are independent or not?.arrow_forwardсх 4. Elongation (in percent) of treated metal plates are random with probability density function: f (x) = ,5 < x < 25 600 Find the value of c which makes f(x) a properly defined pdf. Find the variance of elongation. а. b. Find the probability that the elongation is between 10% and 15% or between 12% and 20%. That is if E is the random variable representing elongation, find P(10 < E < 15 or 12 < E < 20). с.arrow_forward1 Given the probability density function f(x) = 4 over the interval [1, 5], find the expected value, the mean, the variance and the standard deviation. Expected value: Мean: Variance: Standard Deviation:arrow_forwardSuppose that X, Y are independent standard normal RVs. Find the joint pdf of Z, W where Z = XY, W = 3X – 2Y.arrow_forwardThe proportion of people who respond to a certain mail-order solicitation is a random variable X having the following density function. 2(x+2) 5 0arrow_forwardDo number 11 Please writearrow_forwardAn insurer's annual weather related loss, X, is a random variable with density function f(x) = 2.5 (200)2.5 / x3.5 for x >= 200 and 0 otherwise. Calculate the 30th percentiles of X. (Round to 2 decimals).arrow_forwardGggnnnnarrow_forwardData are obtained on the location of incidents on a 12-kilometer-long bridge. The distribution of the distance along the bridge (in kilometers) where an incident occurs is depicted in the density curve below. 12 Distance (kilometers) along the bridge where an accident occurs 12 1. The probability of an incident that occurs in any 4 kilometers long bridge segment is always distributed over any 4-kilometer interval. A. 1/3, uniformly B. 1/3, not uniformly C. 1/6, uniformly D. 1/2, not uniformly To put it another way, the probability is 2. What is P(9 < X < 12)? 1 Same as P(2 < X < 5). 2. Same as P(2 s X < 5). 3. Same as P(2 < X < 5). 4. Same as P(2 < X < 5). A. 1 B. 1 and 2 C. 2, 3, and 4 D. 1. 2. 3, and 4arrow_forwardarrow_back_iosSEE MORE QUESTIONSarrow_forward_iosRecommended textbooks for you
 MATLAB: An Introduction with ApplicationsStatisticsISBN:9781119256830Author:Amos GilatPublisher:John Wiley & Sons Inc
 Probability and Statistics for Engineering and th...StatisticsISBN:9781305251809Author:Jay L. DevorePublisher:Cengage Learning
 Statistics for The Behavioral Sciences (MindTap C...StatisticsISBN:9781305504912Author:Frederick J Gravetter, Larry B. WallnauPublisher:Cengage Learning
 Elementary Statistics: Picturing the World (7th E...StatisticsISBN:9780134683416Author:Ron Larson, Betsy FarberPublisher:PEARSON
 The Basic Practice of StatisticsStatisticsISBN:9781319042578Author:David S. Moore, William I. Notz, Michael A. FlignerPublisher:W. H. Freeman
 Introduction to the Practice of StatisticsStatisticsISBN:9781319013387Author:David S. Moore, George P. McCabe, Bruce A. CraigPublisher:W. H. Freeman
 MATLAB: An Introduction with ApplicationsStatisticsISBN:9781119256830Author:Amos GilatPublisher:John Wiley & Sons Inc
 Probability and Statistics for Engineering and th...StatisticsISBN:9781305251809Author:Jay L. DevorePublisher:Cengage Learning
 Statistics for The Behavioral Sciences (MindTap C...StatisticsISBN:9781305504912Author:Frederick J Gravetter, Larry B. WallnauPublisher:Cengage Learning
 Elementary Statistics: Picturing the World (7th E...StatisticsISBN:9780134683416Author:Ron Larson, Betsy FarberPublisher:PEARSON
 The Basic Practice of StatisticsStatisticsISBN:9781319042578Author:David S. Moore, William I. Notz, Michael A. FlignerPublisher:W. H. Freeman
 Introduction to the Practice of StatisticsStatisticsISBN:9781319013387Author:David S. Moore, George P. McCabe, Bruce A. CraigPublisher:W. H. Freeman