MATLAB: An Introduction with Applications
6th Edition
ISBN: 9781119256830
Author: Amos Gilat
Publisher: John Wiley & Sons Inc
expand_more
expand_more
format_list_bulleted
Question

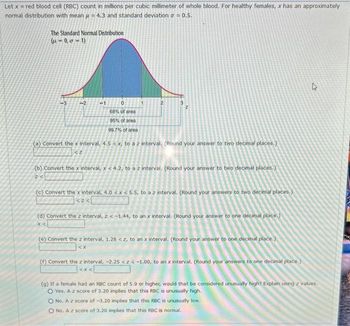
Transcribed Image Text:Let x = red blood cell (RBC) count in millions per cubic millimeter of whole blood. For healthy females, x has an approximately
normal distribution with mean u = 4.3 and standard deviation a = 0.5.
The Standard Normal Distribution
(-0, 0-1)
-3
-2
-1
0
68% of area
95% of area
99.7% of area
2
3
Z
(a) Convert the x interval, 4.5 < x, to a z interval. (Round your answer to two decimal places.)
(b) Convert the x interval, x < 4.2, to a z interval. (Round your answer to two decimal places.)
2<
(c) Convert the x interval, 4.0 < x < 5.5, to a z interval. (Round your answers to two decimal places.)
<><
(d) Convert the z interval, z < -1.44, to an x interval. (Round your answer to one decimal place.)
x <
(e) Convert the z interval, 1.28 <z, to an x interval. (Round your answer to one decimal place.)
<X
(f) Convert the z interval, -2.25 <z<-1.00, to an x interval. (Round your answers to one decimal place.)
<X
4
(g) If a female had an RBC count of 5.9 or higher, would that be considered unusually high? Explain using z values.
O Yes. A z score of 3.20 implies that this RBC is unusually high.
O No. A z score of -3.20 implies that this RBC is unusually low.
O No. A z score of 3.20 implies that this RBC is normal..
Expert Solution
This question has been solved!
Explore an expertly crafted, step-by-step solution for a thorough understanding of key concepts.
This is a popular solution
Trending nowThis is a popular solution!
Step by stepSolved in 2 steps

Knowledge Booster
Similar questions
- Find the area of the shaded region. The graph depicts the standard normal distribution of bone density scores with mean 0 and standard deviation 1.z=−0.93z=1.23 A symmetric bell-shaped curve is plotted over a horizontal scale. Two vertical lines run from the scale to the curve at labeled coordinates “z equals negative 0.93,” which is to the left of the curve’s center and peak, and “z equals 1.23,” which is to the right of the curve’s center and peak. The area under the curve between the vertical lines is shaded.Question content area bottomPart 1The area of the shaded region is enter your response here.(Round to four decimal places as needed.)arrow_forwardAnswer d, e, & f.arrow_forward(a) The figure to the right represents the normal curve with μ=266 days and σ=16 days. The area to the left of X=245 is 0.0947. Provide two interpretations of this area. Provide one interpretation of the area using the given values. Select the correct choice below and fill in the answer boxes to complete your choice. (Type integers or decimals.) A. The proportion of human pregnancies that last more than nothing days is nothing. B. The proportion of human pregnancies that last less than nothing days is nothing.arrow_forward
- Find the area of the shaded region. The graph depicts the standard normal distribution of bone density scores with mean 0 and standard deviation 1. 2= -0.81 z=1.21 The area of the shaded region is (Round to four decimal places as needed.)arrow_forwardFind the area of the shaded region. The graph to the right depicts IQ scores of adults, and those scores are normally distributed with a mean of 100 and a standard deviation of 15. Click to view page 1 of the table, Click to view page 2 of the table. Step 1 теan(u) s tan dard o 90 115 The area of the shaded region is (Round to four decimal places as needed.) Step 2 Required pr X-µ = P = P (Z < 1 = P (Z < 2 = 0.9773 Enter your answer in the answer box and then click Check Answer. %3D All parts showing Clear All Final Check P Type here to search hparrow_forward
arrow_back_ios
arrow_forward_ios
Recommended textbooks for you
 MATLAB: An Introduction with ApplicationsStatisticsISBN:9781119256830Author:Amos GilatPublisher:John Wiley & Sons Inc
 Probability and Statistics for Engineering and th...StatisticsISBN:9781305251809Author:Jay L. DevorePublisher:Cengage Learning
 Statistics for The Behavioral Sciences (MindTap C...StatisticsISBN:9781305504912Author:Frederick J Gravetter, Larry B. WallnauPublisher:Cengage Learning
 Elementary Statistics: Picturing the World (7th E...StatisticsISBN:9780134683416Author:Ron Larson, Betsy FarberPublisher:PEARSON
 The Basic Practice of StatisticsStatisticsISBN:9781319042578Author:David S. Moore, William I. Notz, Michael A. FlignerPublisher:W. H. Freeman
 Introduction to the Practice of StatisticsStatisticsISBN:9781319013387Author:David S. Moore, George P. McCabe, Bruce A. CraigPublisher:W. H. Freeman

MATLAB: An Introduction with Applications
Statistics
ISBN:9781119256830
Author:Amos Gilat
Publisher:John Wiley & Sons Inc

Probability and Statistics for Engineering and th...
Statistics
ISBN:9781305251809
Author:Jay L. Devore
Publisher:Cengage Learning

Statistics for The Behavioral Sciences (MindTap C...
Statistics
ISBN:9781305504912
Author:Frederick J Gravetter, Larry B. Wallnau
Publisher:Cengage Learning

Elementary Statistics: Picturing the World (7th E...
Statistics
ISBN:9780134683416
Author:Ron Larson, Betsy Farber
Publisher:PEARSON

The Basic Practice of Statistics
Statistics
ISBN:9781319042578
Author:David S. Moore, William I. Notz, Michael A. Fligner
Publisher:W. H. Freeman

Introduction to the Practice of Statistics
Statistics
ISBN:9781319013387
Author:David S. Moore, George P. McCabe, Bruce A. Craig
Publisher:W. H. Freeman