
MATLAB: An Introduction with Applications
6th Edition
ISBN: 9781119256830
Author: Amos Gilat
Publisher: John Wiley & Sons Inc
expand_more
expand_more
format_list_bulleted
Related questions
Question

Transcribed Image Text:1:30 4
A ? .ul ul 43
Areas Under Normal...
团:
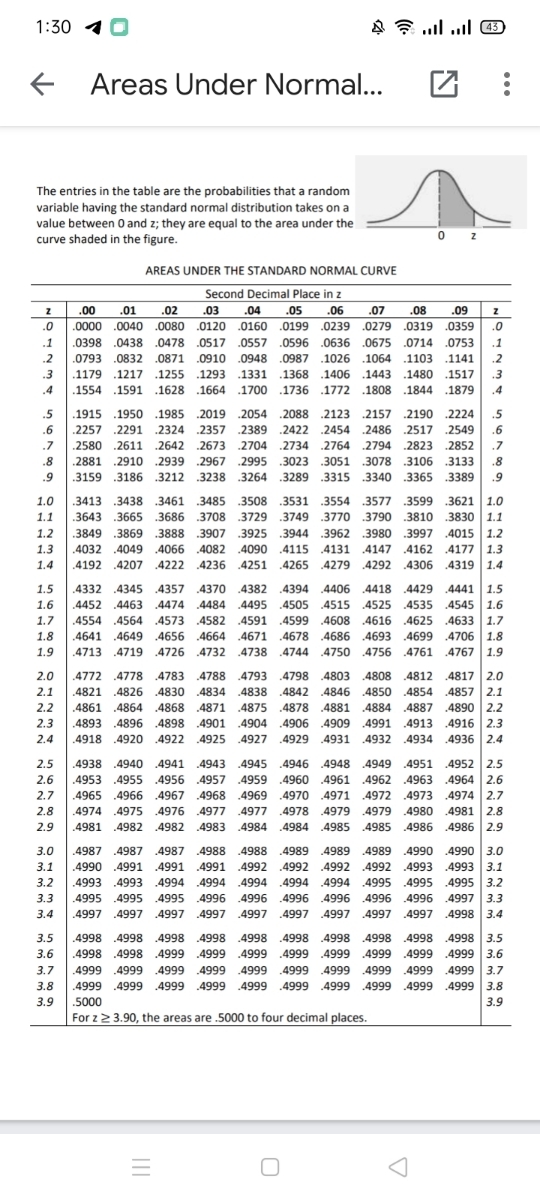
The entries in the table are the probabilities that a random
variable having the standard normal distribution takes on a
value between 0 and z; they are equal to the area under the
curve shaded in the figure.
AREAS UNDER THE STANDARD NORMAL CURVE
Second Decimal Place in z
.00
.01
.02
.03
.04
.05
.06
.07
.08
.09
.0
.0000 .0040 .0080 .0120 .0160 .0199 .0239 .0279 .0319
.0359
.0
.1
.0398 .0438 .0478 .0517 .0557 .0596 .0636 .0675 .0714 .0753
.1
.2
.0793 .0832 .0871 .0910 .0948 .0987 .1026 .1064 .1103 .1141
.2
.3
.1179 .1217
.1255 .1293
.1331 .1368 .1406 .1443
.1480 .1517
.3
.4
.1554 .1591 .1628 .1664 .1700 .1736 .1772 .1808 .1844 .1879
.4
.5
.1915 .1950
.1985 .2019 .2054 .2088 .2123 .2157 .2190 .2224
.5
.6
.2257 .2291 .2324
.2357
2389
.2422 .2454 .2486 .2517
.2549
.6
.7
.2580 .2611 .2642 .2673
.2704 .2734 .2764 .2794 .2823 .2852
.7
.8
.2881 .2910 .2939 .2967 .2995 .3023 .3051 .3078
.3106 .3133
.8
.9
.3159 .3186 3212 3238 .3264 .3289 .3315 .3340 .3365 .3389
.9
3599 3621 1.0
.3749 3770 3790 .3810 3830 1.1
.3849 .3869 3888 .3907 3925 .3944 .3962 .3980 .3997 .4015 1.2
.4032 .4049 4066 .4082 .4090 .4115 .4131 .4147 .4162 .4177 1.3
.4192 .4207 4222 .4236 .4251 .4265 .4279 .4292 .4306 .4319 1.4
1.0
.3413 .3438 .3461
.3485 .3508 .3531 .3554 .3577
1.1
.3643 .3665 .3686 .3708 3729
1.2
1.3
1.4
4441 1.5
.4452 .4463 .4474 4484 .4495 .4505 .4515 .4525 .4535 .4545 1.6
.4554 .4564 4573 .4582 .4591 .4599 .4608 .4616 .4625 .4633 1.7
.4641 .4649 4656 .4664 .4671 .4678 .4686 .4693 .4699 .4706 1.8
.4738 .4744 4750 .4756 4761 .4767 1.9
1.5
.4332 .4345 4357 4370 .4382 .4394 .4406 .4418 .4429
1.6
1.7
1.8
1.9
.4713 .4719 .4726 4732
.4817 2.0
.4854 .4857 2.1
.4887 .4890 2.2
.4893 .4896 4898 .4901 .4904 .4906 .4909 .4991 .4913 .4916 2.3
.4918 .4920 .4922 .4925 .4927 .4929 .4931 .4932 4934 .4936 2.4
2.0
.4772 .4778 .4783 .4788
.4793 .4798 4803 .4808
.4812
2.1
.4821 .4826 .4830 .4834 .4838 .4842 .4846 .4850
2.2
.4861 .4864 .4868 .4871 .4875 .4878 .4881 .4884
2.3
2.4
2.5
.4938 .4940 .4941 .4943 .4945 .4946 .4948 4949 .4951 .4952 2.5
.4960 .4961 .4962 .4963 .4964 2.6
.4965 .4966 4967 .4968 .4969 .4970 .4971 .4972 .4973 .4974 2.7
.4981 2.8
.4981 .4982 .4982 4983 .4984 .4984 4985 .4985 .4986 .4986 2.9
2.6
.4953 .4955 4956 .4957 4959
2.7
2.8
.4974 .4975 4976
4977 .4977 4978 4979 4979
.4980
2.9
.4990 3.0
.4990 .4991 .4991 .4991 4992 .4992 .4992 .4992 .4993 .4993 3.1
.4994 .4994 4994 .4995 4995 .4995 3.2
.4997 3.3
3.4
3.0
.4987 .4987 4987 4988 .4988
.4989 4989 .4989
.4990
3.1
3.2
.4993 .4993 4994 .4994
3.3
.4995 .4995 .4995 4996
.4996 .4996 4996
4996 4996
3.4
.4997 .4997 .4997 .4997 .4997 .4997 .4997 .4997
4997 4998
.4998 3.5
.4998 .4998 4999 .4999 .4999 .4999 .4999 .4999 .4999 .4999 3.6
4999 .4999 3.7
.4999 3.8
3.5
.4998 .4998 .4998 .4998 .4998
.4998 .4998 4998 4998
3.6
3.7
.4999 .4999 4999 4999
.4999 .4999 .4999
3.8
.4999 .4999 4999 .4999 .4999 .4999 .4999 .4999 .4999
3.9
.5000
3.9
For z 2 3.90, the areas are .5000 to four decimal places.

Transcribed Image Text:3. Find the value of z such that
a. the area to the right of z is 0.2266
b. the area between z - -0.23 and z is 0.5722
e. the area between z = 1.15 and z is 0.073
i c
Expert Solution
This question has been solved!
Explore an expertly crafted, step-by-step solution for a thorough understanding of key concepts.

Step by stepSolved in 2 steps with 2 images

Knowledge Booster

Similar questions
- A population of values has a normal distribution with M=153.9 and O=82.9 You intend to draw a random sample of size n=115. A). Find P86, which is the score separating the bottom 86% scores from the top 14% scores. P86 (for single values) =__________ B). Find P86, which is the mean separating the bottom 86% means from the top 14% means. P86 (for sample means) =_________arrow_forwardFind the area under the standard normal curve to the right of z = 2.04 z= 1.09 Genetics: Pea plants contain two genes for seed color, each of which may be Y (for yellow seeds) or G (for green seeds). Plants that contain one of each type of gene are called heterozygous. According to the Mendelian theory of genetics, if two heterozygous plants are crossed, each of their offspring will have probability 0.75 of having yellow seeds and probability 0.25 of having green seeds. One hundred such offspring are produced. Approximate the probability that more than 30 have green seeds.arrow_forwardSuppose that a random variable Z has a standard normal distribution. Use a standard normal table such as this one to determine the probability that Z is between −1.33 and 0.67. Give your answer in decimal form, precise to at least three decimal places. P(−1.33<Z<0.67)=arrow_forward
- Assume that variable z has a standard normal distribution in the population. Use the table of the standard Normal Distribution (attached) to find the probability of a z value in each of the following intervals: (a) 0 to 1.65; (b) 1.95 to ∞; (c) -1.30 to 0; (d) -∞ to 1.00.arrow_forwardFind the probability that a standard normal variable z falls between 0.10 and 0.31. (Provide your answer as a number between 0 and 1, rounded to 4 decimals.)arrow_forwardLet z be a random variable with a standard normal distribution. Find the indicated probability. (Round your answer to four decimal places.) P(z z 1.44) =arrow_forward
arrow_back_ios
arrow_forward_ios
Recommended textbooks for you
- MATLAB: An Introduction with ApplicationsStatisticsISBN:9781119256830Author:Amos GilatPublisher:John Wiley & Sons Inc
 Probability and Statistics for Engineering and th...StatisticsISBN:9781305251809Author:Jay L. DevorePublisher:Cengage Learning
 Statistics for The Behavioral Sciences (MindTap C...StatisticsISBN:9781305504912Author:Frederick J Gravetter, Larry B. WallnauPublisher:Cengage Learning
  Elementary Statistics: Picturing the World (7th E...StatisticsISBN:9780134683416Author:Ron Larson, Betsy FarberPublisher:PEARSON
 The Basic Practice of StatisticsStatisticsISBN:9781319042578Author:David S. Moore, William I. Notz, Michael A. FlignerPublisher:W. H. Freeman
 Introduction to the Practice of StatisticsStatisticsISBN:9781319013387Author:David S. Moore, George P. McCabe, Bruce A. CraigPublisher:W. H. Freeman
MATLAB: An Introduction with Applications
Statistics
ISBN:9781119256830
Author:Amos Gilat
Publisher:John Wiley & Sons Inc
Probability and Statistics for Engineering and th...
Statistics
ISBN:9781305251809
Author:Jay L. Devore
Publisher:Cengage Learning
Statistics for The Behavioral Sciences (MindTap C...
Statistics
ISBN:9781305504912
Author:Frederick J Gravetter, Larry B. Wallnau
Publisher:Cengage Learning
Elementary Statistics: Picturing the World (7th E...
Statistics
ISBN:9780134683416
Author:Ron Larson, Betsy Farber
Publisher:PEARSON
The Basic Practice of Statistics
Statistics
ISBN:9781319042578
Author:David S. Moore, William I. Notz, Michael A. Fligner
Publisher:W. H. Freeman
Introduction to the Practice of Statistics
Statistics
ISBN:9781319013387
Author:David S. Moore, George P. McCabe, Bruce A. Craig
Publisher:W. H. Freeman