MATLAB: An Introduction with Applications
6th Edition
ISBN: 9781119256830
Author: Amos Gilat
Publisher: John Wiley & Sons Inc
expand_more
expand_more
format_list_bulleted
Question
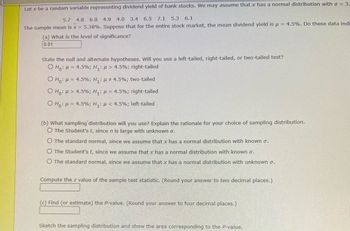
Let x be a random variable representing dividend yield of bank stocks. We may assume that x has a normal distribution with = 3.3%. A random sample of 10 bank stocks gave the following yields (in percents).
5.7
4.8
6.0
4.9 4.0 3.4
6.5 71 5.3 6.1
The sample mean is x = 5.38%. Suppose that for the entire stock market, the mean dividend yield is u= 4.5%. Do these data indicate that the dividend yield of all bank stocks is higher than 4.5%?Use a = 0.01.

Transcribed Image Text:Let x be a random variable representing dividend yield of bank stocks. We may assume that x has a normal distribution with a = 3.
5.7 4.8 6.0 4.9 4.0 3.4 6.5 7.1 5.3 6.1
The sample mean is x = 5.38%. Suppose that for the entire stock market, the mean dividend yield is μ = 4.5%. Do these data indi
(a) What is the level of significance?
0.01
State the null and alternate hypotheses. Will you use a left-tailed, right-tailed, or two-tailed test?
O Ho: = 4.5%; H₁: μ> 4.5%; right-tailed
O Ho:
= 4.5%; H₁: μ ‡ 4.5%; two-tailed
O Ho: > 4.5%; H₁: μ = 4.5%; right-tailed
O Ho: μ = 4.5%; H₁: μ< 4.5%; left-tailed
(b) What sampling distribution will you use? Explain the rationale for your choice of sampling distribution.
O The Student's t, since n is large with unknown o.
O The standard normal, since we assume that x has a normal distribution with known σ.
O The Student's t, since we assume that x has a normal distribution with known σ.
O The standard normal, since we assume that x has a normal distribution with unknown o.
Compute the z value of the sample test statistic. (Round your answer to two decimal places.)
(c) Find (or estimate) the P-value. (Round your answer to four decimal places.)
Sketch the sampling distribution and show the area corresponding to the P-value.

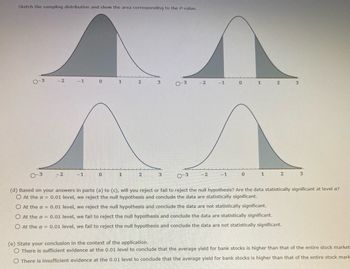
Transcribed Image Text:Sketch the sampling distribution and show the area corresponding to the P-value.
0-3
-2
-2
-1 0
-1
0
1
1
2
3
2
3
0-3
-2 -1
-2
-1
0
0
1
2
2
3
0-3
0-3
(d) Based on your answers in parts (a) to (c), will you reject or fail to reject the null hypothesis? Are the data statistically significant at level a?
O At the a = 0.01 level, we reject the null hypothesis and conclude the data are statistically significant.
O At the a = 0.01 level, we reject the null hypothesis and conclude the data are not statistically significant.
O At the a = 0.01 level, we fail to reject the null hypothesis and conclude the data are statistically significant.
O At the a = 0.01 level, we fail to reject the null hypothesis and conclude the data are not statistically significant.
3
(e) State your conclusion in the context of the application.
There is sufficient evidence at the 0.01 level to conclude that the average yield for bank stocks is higher than that of the entire stock market
O There is insufficient evidence at the 0.01 level to conclude that the average yield for bank stocks is higher than that of the entire stock mark
Expert Solution
This question has been solved!
Explore an expertly crafted, step-by-step solution for a thorough understanding of key concepts.
This is a popular solution
Trending nowThis is a popular solution!
Step by stepSolved in 4 steps with 1 images

Knowledge Booster
Similar questions
- 1. Of all customers purchasing automatic garage-door openers, 57% purchase a chain-driven model. Let X = the number among the next 15 purchasers who select the chain-driven model. a. Calculate P(X > 10). b. Calculate P(8arrow_forwardLet X be a discrete random variable which takes on values in {0, 1, . . . , N}. Show that in that case, the expected value of X can be written as E(X) = N-1 sigma n= 0 P (X > n)arrow_forwardLet x be a random variable representing dividend yield of Australian bank stocks. We may assume that x has a normal distribution with s.d.= 2.3% . A random sample of 12 Australian bank stocks has a sample mean of x=6.16% . For the entire Australian stock market, the mean dividend yield is 7.2%. Do these data indicate that the dividend yield of all Australian bank stocks is higher than 7.2%? Find (or estimate) the P-value. Round your answer to three decimal places.arrow_forwardA sample of 10 different parts are tested using a low temperature level and another sample of 10 parts is also tested using a high temperature level. The random variable of interest is the shrinkage that occurred in the units, measured in percentage. Assume that the data sets follow the normal distribution. The results are as follows: Low Temperature High Temperature 17.9 21.2 17.6 20.9 18.3 19.8 15.9 20.3 16.5 20.5 17.8 21.3 16.1 20.8 18.7 19.7 16.4 21.5 17.2 20.3 s = 0.9709 a) Compare the variances of the temperatures using a hypothesis test with a significance level of 0.02. Set up the appropriate hypotheses test to check if there is a difference between the variances. b) Compute a 98% two-sided confidence interval on the appropriate parameter to check if there is a difference between the variances.arrow_forwardOn average, a banana will last 6.1 days from the time it is purchased in the store to the time it is too rotten to eat. Is the mean time to spoil greater if the banana is hung from the ceiling? The data show results of an experiment with 13 bananas that are hung from the ceiling. Assume that that distribution of the population is normal. 7.4, 7.5, 7.9, 5.7, 5.9, 8.1, 4.8, 8.7, 6.8, 5.9, 8.2, 5.1, 5.1 What can be concluded at the the αα = 0.10 level of significance level of significance? For this study, we should use Correct The alternative hypothesis would be: H1:H1: Correct Correct Correct The test statistic Correct = (please show your answer to 3 decimal places.) Based on this, we should Correct the null hypothesis. Thus, the final conclusion is that ...arrow_forwardThe daily high temperature for the month of August in Chicago is normally distributed with a mean of 70 degrees and a standard deviation of 5 degrees. QUESTION 1 What is the probability that a randomly selected August day in Chicago will have a high temperature below 85 degrees? Use the given normal distribution curve below to help you label and shade the correct picture for this problem. O A. 0.9987 О в. 0.0013 OC.0.4987 O D. 0.0087 Save All Answers Save and Submit Click Save and Submit to saue and submit. Click Save All Answers to save all answers. 6:35 PM e Type here to search 11/30/202 10/05/17 F1 F2 F3 F4 F5 F6 F7 F8 PrtSc Insert Delete F9 F10 F11 F12 C@ & 3 5 6 7 080 9- Backspace Num Lock T Y U 1 PI 00 Home + II S4 LI 2arrow_forwardSuppose a professor uses a normal distribution to assign grades in her math class. • She assigns an A to students scoring more than 1.9 standard deviations above the mean. • She assigns an F to students scoring more than 2.2 standard deviations below the mean. She assigns a B to students who Score between 1 and 1.9 standard deviations above the mean. • She assigns a D to students who Score between 1.2 and 2.2 standard deviations below the mean. • All other students get a C. Use the Cumulative Z-Score Table to answer the following questions. The Z-Score Table can be found below by selecting "Read". Write your answer as a percent using 2 decimal places. What percent of the class receives each grade assuming the scores are normally distributed? Hint % will recieve an A % will recieve a B % will recieve a C % will recieve a D % will recieve an Farrow_forwardOn average, a banana will last 6.1 days from the time it is purchased in the store to the time it is too rotten to eat. Is the mean time to spoil greater if the banana is hung from the ceiling? The data show results of an experiment with 12 bananas that are hung from the ceiling. Assume that that distribution of the population is normal. 5.5, 6.6, 5.1, 8.4, 7.1, 5.1, 4.8, 5.1, 8.1, 5.4, 7, 7.8 What can be concluded at the the a = 0.05 level of significance level of significance? a. For this study, we should use Select an answer b. The null and alternative hypotheses would be: Ho: ? Select an answer ✓ H₁: ? Select an answer ✓ 4 c. The test statistic?v= (please show your answer to 3 decimal places.) (Please show your answer to 4 decimal places.) d. The p-value =arrow_forwardA certain brokerage house wants to estimate the mean daily return on a certain stock. A random sample of 12 days yields the following return percentages.−1.81, 1.54, 1.52, −2.58, −2.3, 0.97, 0.93, −1.06, 1.04, 0.2, −0.63, −2.75 Send data to calculator If we assume that the returns are normally distributed, find a 90% confidence interval for the mean daily return on this stock. Then find the lower limit and upper limit of the 90% confidence interval. Carry your intermediate computations to at least three decimal places. Round your answers to one decimal place. (If necessary, consult a list of formulas.) Lower limit: ? Upper limit: ?arrow_forwardarrow_back_iosarrow_forward_ios
Recommended textbooks for you
 MATLAB: An Introduction with ApplicationsStatisticsISBN:9781119256830Author:Amos GilatPublisher:John Wiley & Sons Inc
 Probability and Statistics for Engineering and th...StatisticsISBN:9781305251809Author:Jay L. DevorePublisher:Cengage Learning
 Statistics for The Behavioral Sciences (MindTap C...StatisticsISBN:9781305504912Author:Frederick J Gravetter, Larry B. WallnauPublisher:Cengage Learning
 Elementary Statistics: Picturing the World (7th E...StatisticsISBN:9780134683416Author:Ron Larson, Betsy FarberPublisher:PEARSON
 The Basic Practice of StatisticsStatisticsISBN:9781319042578Author:David S. Moore, William I. Notz, Michael A. FlignerPublisher:W. H. Freeman
 Introduction to the Practice of StatisticsStatisticsISBN:9781319013387Author:David S. Moore, George P. McCabe, Bruce A. CraigPublisher:W. H. Freeman

MATLAB: An Introduction with Applications
Statistics
ISBN:9781119256830
Author:Amos Gilat
Publisher:John Wiley & Sons Inc

Probability and Statistics for Engineering and th...
Statistics
ISBN:9781305251809
Author:Jay L. Devore
Publisher:Cengage Learning

Statistics for The Behavioral Sciences (MindTap C...
Statistics
ISBN:9781305504912
Author:Frederick J Gravetter, Larry B. Wallnau
Publisher:Cengage Learning

Elementary Statistics: Picturing the World (7th E...
Statistics
ISBN:9780134683416
Author:Ron Larson, Betsy Farber
Publisher:PEARSON

The Basic Practice of Statistics
Statistics
ISBN:9781319042578
Author:David S. Moore, William I. Notz, Michael A. Fligner
Publisher:W. H. Freeman

Introduction to the Practice of Statistics
Statistics
ISBN:9781319013387
Author:David S. Moore, George P. McCabe, Bruce A. Craig
Publisher:W. H. Freeman