
MATLAB: An Introduction with Applications
6th Edition
ISBN: 9781119256830
Author: Amos Gilat
Publisher: John Wiley & Sons Inc
expand_more
expand_more
format_list_bulleted
Related questions
Question
thumb_up100%
APPLIED STATISTICS
UPVOTE WILL BE GIVEN. PLEASE ANSWER THE PROBLEM BY USING SPSS OR EXCEL ONLY (NOT HANDWRITTEN). NO LONG EXPLANATION NEEDED. TAKE A SCREENSHOTS AND ANSWER THE QUESTION IN SENTENCES.
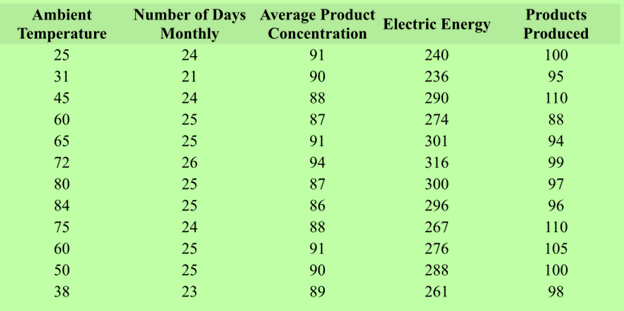
The electric energy consumed each month by a manufacturingwarehouse is imagined to be linked to the ambient temperature, the number of days monthly, average product concentration, and products produced. The annual data based on last year are presented in the following table:
a. Identify the dependent and independed variable then estimate the multiple regression equation.
b. What is the r-squared value and what is its implication?
c. What variable/s are considered significant? What is the p-value?

Transcribed Image Text:Ambient
Temperature
25
31
45
60
65
72
80
84
75
60
50
38
Number of Days Average Product
Concentration
Monthly
24
91
21
90
24
88
87
91
25
25
26
25
25
24
25
25
23
94
87
86
88
91
90
89
Electric Energy
240
236
290
274
301
316
300
296
267
276
288
261
Products
Produced
100
95
110
88
94
99
97
96
110
105
100
98
Expert Solution
This question has been solved!
Explore an expertly crafted, step-by-step solution for a thorough understanding of key concepts.

Step by stepSolved in 3 steps with 1 images

Knowledge Booster

Similar questions
- Kindly answer 1-2arrow_forwardThe ages (in years)and heights (in inches) of all pitchers for a baseball team are listed. Find the cofficient of a variation for each of the two data sets. Then compare the result.arrow_forwardDetermine the interquartile range of the following data: 155, 134, 153, 119, 89.arrow_forward
- In California, they need more rain to sustain the health of the natural environment, state argriculture, and state economy. A group of statistics students in Oxnard College recorded the amount of rain during 2016-2017 school year, measuring the intensity by the inches of rain, and the results were: Daily Rain Amounts Inches of Rain 1 2 3 4 5 6 Frequency 7 6 6 3 2 1 The mean rain intensity: ________inches (Please show your answer to 1 decimal place.) The median rain intensity: _______inches The mode rain intensity: _______inches Please separate your answers by a comma if there is more than one mode.arrow_forwardAdd the means and divide them by two for each pre-1945 and post-1945 and make an excel bar graph based off this data with error bars on grapharrow_forwardTrying to determine the number of students to accept is a tricky task for universities. The Admissions staff at a small private college wants to use data from the past few years to predict the number of students enrolling in the university from those who are accepted by the university. The data are provided in the following table. R F eTextbook and Media Save for Late O % 5 T O >> G H (9) 2 Number Accepted Number Enrolled Find the correlation between the number of students accepted and enrolled. Use two decimal places in your answer. & 2,440 2,800 2,720 2,360 2,660 2,620 8 6 611 K 708 637 584 614 625 ( 9 L Attempts: 0 of 1 used ) 0 P Submit Answer 56°F Cl Backspaarrow_forward
- Data: 3.5, 3.2, 3.1, 3.5, 3.6, 3.2, 3.4, 2.9, 4.1, 2.6, 3.3, 3.5, 3.9, 3.8, 3.7, 3.4, 3.6, 3.5, 3.5, 3.7, 3.6, 3.8, 3.2, 3.4, 4.2, 3.6, 3.1, 2.9, 2.5, 3.5, 3.1, 3.2, 3.7, 3.8, 3.4, 3.6, 3.5, 3.2, 3.6, 3.8 Sketch a histogram with ranges of 0.1, from minimum (2.5) to maximum (4.2) values. Then sketch a histogram with ranges of 0.3. You can include the relative frequency scales on the same sketches.arrow_forwardPlease answer in detailarrow_forwardThe data in the picture contains purchase data for golf purchases. Create a doughnut chart in Excel to compare the purchases by gender each year with the US population. Below the chart, explain what it illustrates.arrow_forward
- Beanie babies are toy stuffed animals that have become valuable collector’s items. Beanie World Magazine provided the age, retired status (R for Retired and C for Current), and value of 50 Beanie babies. The data Beanie can be downloaded from Blackboard. Answer the following questions using Minitab. a) Show the retired/current status of the 50 Beanie babies with pie chart and bar chart. b) What percentage of the age measurements actually fall into ¯x±s, ¯x±2s, and ¯x±3s. Compare your result with the empirical rulearrow_forwardGraph the data in a scatter diagram: Age Calories 765 1520 15 2540 500 5. 795 17 2350 6. 1900 Use the paperclip button below to attach files. XDG BIUに ..arrow_forward
arrow_back_ios
arrow_forward_ios
Recommended textbooks for you
- MATLAB: An Introduction with ApplicationsStatisticsISBN:9781119256830Author:Amos GilatPublisher:John Wiley & Sons Inc
 Probability and Statistics for Engineering and th...StatisticsISBN:9781305251809Author:Jay L. DevorePublisher:Cengage Learning
 Statistics for The Behavioral Sciences (MindTap C...StatisticsISBN:9781305504912Author:Frederick J Gravetter, Larry B. WallnauPublisher:Cengage Learning
  Elementary Statistics: Picturing the World (7th E...StatisticsISBN:9780134683416Author:Ron Larson, Betsy FarberPublisher:PEARSON
 The Basic Practice of StatisticsStatisticsISBN:9781319042578Author:David S. Moore, William I. Notz, Michael A. FlignerPublisher:W. H. Freeman
 Introduction to the Practice of StatisticsStatisticsISBN:9781319013387Author:David S. Moore, George P. McCabe, Bruce A. CraigPublisher:W. H. Freeman
MATLAB: An Introduction with Applications
Statistics
ISBN:9781119256830
Author:Amos Gilat
Publisher:John Wiley & Sons Inc
Probability and Statistics for Engineering and th...
Statistics
ISBN:9781305251809
Author:Jay L. Devore
Publisher:Cengage Learning
Statistics for The Behavioral Sciences (MindTap C...
Statistics
ISBN:9781305504912
Author:Frederick J Gravetter, Larry B. Wallnau
Publisher:Cengage Learning
Elementary Statistics: Picturing the World (7th E...
Statistics
ISBN:9780134683416
Author:Ron Larson, Betsy Farber
Publisher:PEARSON
The Basic Practice of Statistics
Statistics
ISBN:9781319042578
Author:David S. Moore, William I. Notz, Michael A. Fligner
Publisher:W. H. Freeman
Introduction to the Practice of Statistics
Statistics
ISBN:9781319013387
Author:David S. Moore, George P. McCabe, Bruce A. Craig
Publisher:W. H. Freeman