MATLAB: An Introduction with Applications
6th Edition
ISBN: 9781119256830
Author: Amos Gilat
Publisher: John Wiley & Sons Inc
expand_more
expand_more
format_list_bulleted
Question
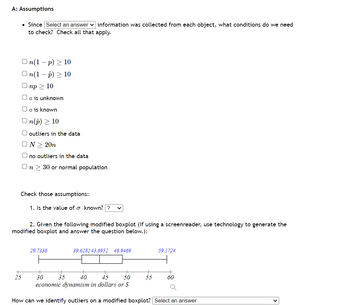
The economic dynamism, which is the index of productive growth in dollars for countries that are designated by the World Bank as middle-income, for a random sample of middle-income countries are in the table below. Compute a 91% confidence interval for the
| economic dynamism in dollars or $ |
|---|
| 58.6955 |
| 33.6074 |
| 42.0265 |
| 43.7178 |
| 43.8555 |
| 49.1803 |
| 32.989 |
| 39.6282 |
| 39.6553 |
| 46.0521 |
| 51.915 |
| 43.0364 |
| 48.3652 |
| 50.9866 |
| 47.8506 |
| 41.9285 |
| 50.4578 |
| 58.5099 |
| 59.1724 |
| 45.7354 |
| 41.4885 |
| 37.4511 |
| 30.5338 |
| 43.6952 |
| 38.0793 |
| 49.1361 |
| 43.6252 |
| 41.9543 |
| 48.9469 |
| 37.7251 |
| 29.7336 |
| 41.1648 |
| 39.1469 |
| 29.7336 |
| 48.6159 |
| 58.0767 |
| 44.9346 |
| 43.6952 |

Transcribed Image Text:A: Assumptions
• Since Select an answer information was collected from each object, what conditions do we need
to check? Check all that apply.
On(1-p) ≥ 10
n(1 − p) ≥ 10
Onp > 10
Uo is unknown
o is known
On(p) > 10
+
25
outliers in the data
ON > 20n
no outliers in the data
On > 30 or normal population
Check those assumptions:
1. Is the value of o known?? V
2. Given the following modified boxplot (If using a screenreader, use technology to generate the
modified boxplot and answer the question below.):
29.7336
39.628243.6952 48.9469
35
59.1724
40
30
45 50
economic dynamism in dollars or S
How can we identify outliers on a modified boxplot? Select an answer
60

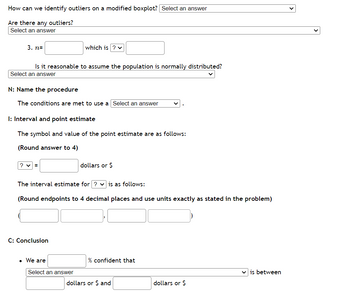
Transcribed Image Text:How can we identify outliers on a modified boxplot? | Select an answer
Are there any outliers?
Select an answer
3. n=
Is it reasonable to assume the population is normally distributed?
Select an answer
N: Name the procedure
The conditions are met to use a Select an answer
I: Interval and point estimate
The symbol and value of the point estimate are as follows:
(Round answer to 4)
?v=
which is ? ✓
C: Conclusion
The interval estimate for ? is as follows:
(Round endpoints to 4 decimal places and use units exactly as stated in the problem)
• We are
Select an answer
dollars or $
% confident that
dollars or $ and
dollars or $
✓is between
Expert Solution
This question has been solved!
Explore an expertly crafted, step-by-step solution for a thorough understanding of key concepts.
Step by stepSolved in 6 steps with 22 images

Knowledge Booster
Similar questions
- How much money do winners go home with from the television quiz show Jeopardy? To determine an answer, a random sample of winners was drawn and the amount of money each won was recorded and listed below. Estimate with 90% confidence the mean winning's for all the show's players. UCL = LCL = 31445 30081 22151 13577 12934 28082 21724 17060 15596 14965 31441 15773 22051 31778 12500arrow_forwardAccording to a study, brain weights of men in country A are normally distributed with mean 1.39kg and standard deviation 0.15kg. Apply the empirical rule to complete each sentence. Complete parts (a) through (d). a. Complete the sentence "Approximately 68% of the men have brain weights between _____ kg and _____ kg." Approximately 68% of the men have brain weights between kg and kg.(Type integers or decimals. Do not round) b. Complete the sentence "Approximately 95% of the men have brain weights between _____ kg and _____ kg." Approximately 95% of the men have brain weights between kg and kg.(Type integers or decimals. Do not round)arrow_forwardAn employment information service claims the mean annual salary for senior level product engineers is $97,000. The annual salaries (in dollars) for a random sample of 16 senior level product engineers are shown in the table to the right. At a = 0.05, test the claim that the mean salary is $97,000. Complete parts (a) through (e) below. Assume the population is normally distributed (a) Identify the claim and state Ho and Ha Ho Ha (Type integers or decimals. Do not round.) ▼ hypothesis. The claim is the LIGH Annual Salaries 100,717 82,433 96,266 93,467 112,821 0 74,231 76,945 80,898 76,148 104,098 103,928 102,409 91,022 82,037 85,121 110,335 111arrow_forward
- 3. A survey was conducted two years ago asking college students their top motivations for using a credit card. To determine whether this distribution has changed, you randomly select 425 college students and ask each one what the top motivation is for using a credit card. Can you conclude that there has been a change in the claimed or expected distribution? Use a = 0.10. Complete parts (a) through (d). Response Old Survey % 27% New Survey Frequency, f Rewards Low rates Cash back Discounts Other 110 24% 98 21% 107 7% 46 21% 64 a. State H, and H, and identify the claim. What is the null hypothesis, Ho? O A. The distribution of motivations differs from the expected distribution. O B. The distribution of motivations is 27% rewards, 24% low rate, 21% cash back, 7% discounts, and 21% other. O C. The distribution of motivations is 110 rewards, 98 low rate, 107 cash back, 46discounts, and 64 other. What is the alternate hypothesis, H,? O A. The distribution of motivations differs from the…arrow_forwardCalculate the 95% prediction intervals for the four different investments included in the following table. Small Stocks S&P 500 12.84% 18.25% 38.48% 19.22% Average Return Standard Deviation of returns G Corporate Bonds 6.09% 7.95% The 95% prediction interval of small stocks is between % and %. (Round to two decimal places and put the lower number first.) T-Bills 3.25% 4.02%arrow_forwardThe trade volume of a stock is the number of shares traded on a given day. A random sample of trading days from the past year is selected, and the volume of PepsiCo stock, in millions of shares, is recorded for each day. A normality test is performed on the resulting data, producing the output below. Based on this sample, construct a 99% confidence interval for the mean daily trade volume of PepsiCo during the past year. Percent 99 95 90 80 70 60- 50- 40 30 20- 10 5- -3 • 4 Probability Plot of PepsiCo Volume Normal 5 6 7 8 PepsiCo Volume 9 10 11 Mean StDev N AD P-Value 5.864 1.148 38 0.822 0.031arrow_forward
- Chapter 3 271 Forecast (X) Number of Analysts (n;) 1.40 1 1.43 1.44 1.45 2 1.47 1 1.48 1.50 Because the sample is a small fraction of the number of analysts who follow this stock, assume that we can ignore the finite population correction factor. Assume that the analyst forecasts are normally distributed. A. What are the mean forecast and standard deviation of forecasts? B. Provide a 95 percent confidence interval for the population mean of the forecasts.arrow_forwardTrue or false? If the original x distribution has a relatively small standard deviation, the confidence interval for ? will be relatively short. a. False. As ? decreases, E decreases, resulting in a longer confidence interval. b. True. As ? decreases, E increases, resulting in a shorter confidence interval. c. True. As ? decreases, E decreases, resulting in a shorter confidence interval. e. False. As ? decreases, E increases, resulting in a longer confidence interval.arrow_forwardExercise 3. A personal manager has found that historically the scores on aptitude tests given to applicants for entry-level positions follow a normal distribution with a standard deviation of 32.4 points. A random sample of nine test scores from the current group of applicants had a mean score of 187.9 points. a. Find an 80% confidence interval for the population mean score of the current group of applicants. b. Based on these sample results a statistician found for the population mean a confidence interval extending from 165.8 to 210.0 points. Find the confidence level of this interval.arrow_forward
- A magazine reported that at the top 50 business schools in a region, students studied an average of 13.3 hours. Set up a hypothesis test to try to prove that the mean number of hours studied at your school is different from the reported 13.3 hour benchmark. Complete parts (a) through (c) below. O E. H X#13.3 H: X= 13.3 P. Ho p=13.3 H, p#13.3 O G. H, p= 13.3 H, X+13.3 OH. H, p#13.3 H, p=13.3 OL H a 13.3 H: a = 13.3 O J. Ho a= 13.3 H a# 13.3 O K. H, p# 13.3 H1: X= 13.3 OL Ho B#13.3 H B= 13.3 b. What is a Type I error for your test? A. Concluding that the mean number of hours studied at your school is different from the reported 13.3 hour benchmark when in fact it is not different O B. Concluding that the mean number of hours studied at your school is different from the reported 13.3 hour benchmark when in fact it is different C. Concluding that the mean number of hours studied at your school is not different from the reported 13.3 hour benchmark when in fact it is different c. What is a…arrow_forward12)arrow_forwardEuropean unemployment has been relatively high in recent years. The following table contains the percent of unemployed in the 15 countries in the EU in 2007. 2. Belgium 7.8 Denmark 3.2 Portugal 7.2 France 8.4 Italy 6.7 Finland 7.0 Germany 7.7 Netherlands 3.6 Austria 4.5 Luxembourg 5.0 Sweden 6.0 UK 5.4 Greece 8.7 Spain 8.6 Ireland 4.4 a) Use R to compute the mean, median and standard deviation of the data. b) Determine the range for the middle 68% of the data. c) Determine the range for the middle 60% of the data. (Hint: Compute the quintiles.)arrow_forward
arrow_back_ios
arrow_forward_ios
Recommended textbooks for you
 MATLAB: An Introduction with ApplicationsStatisticsISBN:9781119256830Author:Amos GilatPublisher:John Wiley & Sons Inc
 Probability and Statistics for Engineering and th...StatisticsISBN:9781305251809Author:Jay L. DevorePublisher:Cengage Learning
 Statistics for The Behavioral Sciences (MindTap C...StatisticsISBN:9781305504912Author:Frederick J Gravetter, Larry B. WallnauPublisher:Cengage Learning
 Elementary Statistics: Picturing the World (7th E...StatisticsISBN:9780134683416Author:Ron Larson, Betsy FarberPublisher:PEARSON
 The Basic Practice of StatisticsStatisticsISBN:9781319042578Author:David S. Moore, William I. Notz, Michael A. FlignerPublisher:W. H. Freeman
 Introduction to the Practice of StatisticsStatisticsISBN:9781319013387Author:David S. Moore, George P. McCabe, Bruce A. CraigPublisher:W. H. Freeman

MATLAB: An Introduction with Applications
Statistics
ISBN:9781119256830
Author:Amos Gilat
Publisher:John Wiley & Sons Inc

Probability and Statistics for Engineering and th...
Statistics
ISBN:9781305251809
Author:Jay L. Devore
Publisher:Cengage Learning

Statistics for The Behavioral Sciences (MindTap C...
Statistics
ISBN:9781305504912
Author:Frederick J Gravetter, Larry B. Wallnau
Publisher:Cengage Learning

Elementary Statistics: Picturing the World (7th E...
Statistics
ISBN:9780134683416
Author:Ron Larson, Betsy Farber
Publisher:PEARSON

The Basic Practice of Statistics
Statistics
ISBN:9781319042578
Author:David S. Moore, William I. Notz, Michael A. Fligner
Publisher:W. H. Freeman

Introduction to the Practice of Statistics
Statistics
ISBN:9781319013387
Author:David S. Moore, George P. McCabe, Bruce A. Craig
Publisher:W. H. Freeman