
MATLAB: An Introduction with Applications
6th Edition
ISBN: 9781119256830
Author: Amos Gilat
Publisher: John Wiley & Sons Inc
expand_more
expand_more
format_list_bulleted
Related questions
Question
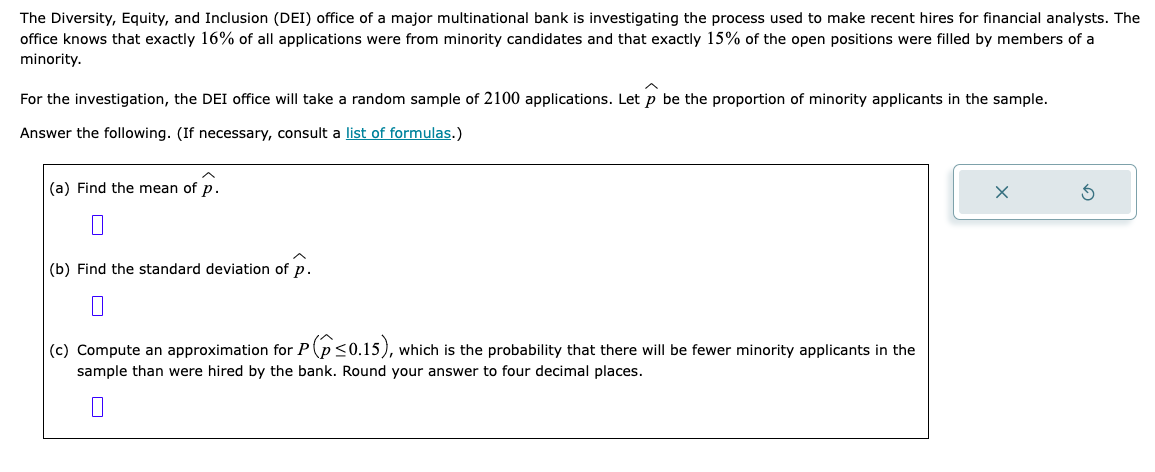

Transcribed Image Text:The Diversity, Equity, and Inclusion (DEI) office of a major multinational bank is investigating the process used to make recent hires for financial analysts. The
office knows that exactly 16% of all applications were from minority candidates and that exactly 15% of the open positions were filled by members of a
minority.
For the investigation, the DEI office will take a random sample of 2100 applications. Let p be the proportion of minority applicants in the sample.
Answer the following. (If necessary, consult a list of formulas.)
(a) Find the mean of p.
(b) Find the standard deviation of p.
(c) Compute an approximation for P<0.15), which is the probability that there will be fewer minority applicants in the
sample than were hired by the bank. Round your answer to four decimal places.
0
X
Expert Solution
This question has been solved!
Explore an expertly crafted, step-by-step solution for a thorough understanding of key concepts.

This is a popular solution

Trending nowThis is a popular solution!

Step by stepSolved in 2 steps

Knowledge Booster

Similar questions
- sixty-five percent of those surveyed reply No to a certain question. If 234 reply No, what is the sample size?arrow_forwardA political campaign wants to estimate the number of adult residents who voted in the last city election. Answer the following. (a) Which of the following surveys probably would best represent the entire adult population of the city? 50 senior residents are randomly selected; 42 voted in the last election. 50 adult residents are randomly selected from the city; 25 voted in the last election. 50 business owners are randomly selected; 38 voted in the last election. (b) There are 16,800 adults who live in the city. Using your answer from part (a), estimate the number of adults who voted in the last city election. adultsarrow_forwardA researcher wants to determine the percentage of American teenagers who send or receive text messages while doing homework. Which of the following techniques would likely be the MOST efficient way of obtaining an accurate estimate for this percentage? 1. Randomly select teenagers from the list of all teenage students in every state in America and mail surveys to those teens, asking them if they send or receive text messages while doing homework. 2. Send a survey to every teenager in America and ask them if they send or receive text messages while doing homework. 3. Randomly select teenagers from the list of all teenage students in one state and mail surveys to those teens, asking them if they send or receive text messages while doing homework.arrow_forward
- Among college students, the proportion p who say they’re interested in their congressional district’s election results has traditionally been 75% . After a series of debates on campuses, a political scientist claims that the proportion of college students who say they’re interested in their district’s election results is more than 75% . A poll is commissioned, and 207 out of a random sample of 275 college students say they’re interested in their district’s election results. Is there enough evidence to support the political scientist's claim at the 0.01 level of significance? Perform a one-tailed test. Then complete the parts below. Carry your intermediate computations to three or more decimal places. (If necessary, consult a list of formulas.) (a) State the null hypothesis H0 and the alternative hypothesis H1 . H0: H1: (b) Determine the type of test statistic to use. ▼(Choose one) (c) Find the value of the test statistic. (Round…arrow_forwardIn 1942, an organization surveyed 1100 adults and asked, "Are you a total abstainer from, or do you on occasion consume, alcoholic beverages?" Of the 1100 adults surveyed, 440 indicated that they were total abstainers. In a recent survey, the same question was asked of 1100 adults and 418 indicated that they were total abstainers. Complete parts (a) and (b) below. (a) Determine the sample proportion for each sample. and respectively. The proportions of the adults who took the 1942 survey and the recent survey who were total abstainers are (Round to three decimal places as needed.)arrow_forwardAccording to the National Center for Education Statistics, 43% of the college students work full time. A survey of 900 randomly selected college students is to be conducted. For such groups of 900, would it be unusual to get 735 college students who work fulltime?arrow_forward
- To collect data about the number of students in your high school who have a part time job, which of the following methods is most likely to lead to a sample that is the most representative of the students in your school? Interview all the girls in the school. Ask the principal. Interview all the students in 9th grade. Assign each student in the school a number and randomly select students to be interviewed. Interview all the students who are on the sports teams in the school.arrow_forwardThe Institute of Education Sciences measures the high school dropout rate as the percentage of 16- through 24-year-olds who are not enrolled in school and have not earned a high school credential. In 2009, the high school dropout rate was 8.1%. A polling company recently took a survey of 1000 people between the ages of 16 and 24 and found 6.5% of them are high school dropouts. The polling company would like to determine whether the dropout rate has decreased at a 5% significance level. reject HO we can conclude that the high school dropout rate has decreased reject HO we cannot conclude that the high school dropout rate has decreased do not reject HỒ we cannot conclude that the high school dropout rate has decreased do not reject HỒ we can conclude that the high school dropout rate has decreasedarrow_forwardSuppose an internet marketing company wants to determine the current percentage of customers who click on ads on their smartphones. How many customers should the company survey in order to be 90% confident that the estimated proportion is within 2 percentage points of the true population proportion of customers who click on ads on their smartphones?arrow_forward
arrow_back_ios
arrow_forward_ios
Recommended textbooks for you
- MATLAB: An Introduction with ApplicationsStatisticsISBN:9781119256830Author:Amos GilatPublisher:John Wiley & Sons Inc
 Probability and Statistics for Engineering and th...StatisticsISBN:9781305251809Author:Jay L. DevorePublisher:Cengage Learning
 Statistics for The Behavioral Sciences (MindTap C...StatisticsISBN:9781305504912Author:Frederick J Gravetter, Larry B. WallnauPublisher:Cengage Learning
  Elementary Statistics: Picturing the World (7th E...StatisticsISBN:9780134683416Author:Ron Larson, Betsy FarberPublisher:PEARSON
 The Basic Practice of StatisticsStatisticsISBN:9781319042578Author:David S. Moore, William I. Notz, Michael A. FlignerPublisher:W. H. Freeman
 Introduction to the Practice of StatisticsStatisticsISBN:9781319013387Author:David S. Moore, George P. McCabe, Bruce A. CraigPublisher:W. H. Freeman
MATLAB: An Introduction with Applications
Statistics
ISBN:9781119256830
Author:Amos Gilat
Publisher:John Wiley & Sons Inc
Probability and Statistics for Engineering and th...
Statistics
ISBN:9781305251809
Author:Jay L. Devore
Publisher:Cengage Learning
Statistics for The Behavioral Sciences (MindTap C...
Statistics
ISBN:9781305504912
Author:Frederick J Gravetter, Larry B. Wallnau
Publisher:Cengage Learning
Elementary Statistics: Picturing the World (7th E...
Statistics
ISBN:9780134683416
Author:Ron Larson, Betsy Farber
Publisher:PEARSON
The Basic Practice of Statistics
Statistics
ISBN:9781319042578
Author:David S. Moore, William I. Notz, Michael A. Fligner
Publisher:W. H. Freeman
Introduction to the Practice of Statistics
Statistics
ISBN:9781319013387
Author:David S. Moore, George P. McCabe, Bruce A. Craig
Publisher:W. H. Freeman