MATLAB: An Introduction with Applications
6th Edition
ISBN: 9781119256830
Author: Amos Gilat
Publisher: John Wiley & Sons Inc
expand_more
expand_more
format_list_bulleted
Concept explainers
Question
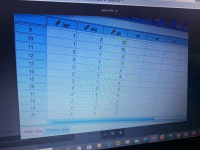
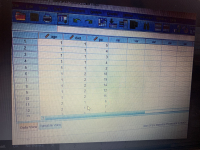
Graph the interaction. On the “Category Axis” box put “maternal diet”. On the “Define Lines by” box put “age. Paste the graph into a word document and upload the file.


Expert Solution
This question has been solved!
Explore an expertly crafted, step-by-step solution for a thorough understanding of key concepts.
This is a popular solution
Trending nowThis is a popular solution!
Step by stepSolved in 2 steps with 1 images

Knowledge Booster
Learn more about
Need a deep-dive on the concept behind this application? Look no further. Learn more about this topic, statistics and related others by exploring similar questions and additional content below.Similar questions
- Please help.arrow_forwardFirst Differences Assessment y 5 diff 1. Calculate the first differences. Decide whether the -2 relation is linear or non-linear. -1 1 2 3 4 5 The relationship is_ 2. Complete the table. Is each relation linear or non-linear? y = 4x + 3 y diff X -2 -1 1 2 3 4 The relationship is_arrow_forwardMrs. Hoover wanted to know which cookies kindergartners in Spring School District like best. Three hundred students were asked their favorite kind of cookie. The results are displayed in the graph below. About how many kindergartners prefer chocolate chip?arrow_forward
- A car dealership is analyzing the changes in its monthly sales. They sold 40 cars in March, 55 in April, 61 in May, 29 in June, 63 in July, and 40 in August. Create line graph that represents this data. 3.arrow_forward2. Use the graph below to answer the items that follow: pain_data$sex -0- female male A В C Treatment Type a. Is there a main effect of Sex? Explain b. Is there a main effect of Treatment? Explain. c. Is there an interaction between Sex and Treatment? Explain. Time (in minutes) 15 25 35 07arrow_forwardTamarr needs to buy shredded wood for his children's playground. The shredded wood costs $5 per ton, and there is a delivery cost of $16 with each order. *Make a table showing ordered pairs with at least three points.arrow_forward
- How do you make a stem and leaf graph with numbers such as these 0.06, 0.07,0.09,... 0.35 including a key. Thank youarrow_forwardGraph. y = −4 Graph. x = −8arrow_forwardProvide an appropriate response using correct mathematical notation and vocabulary in the space below. Use the equation editor as needed for mathematical notation.On a recent Statistics test, the scores were 15, 66, 66, 81, 82, 83, 85, 88, 90, 92, 93, and 95. Is the mean a good representation of the center of data? If not, explain why not and identify a better representation of the center of data.arrow_forward
- Tech Company Employees Construct a vertical and horizontal bar graph for the number of employees (in thousands) of a sample of the largest tech companies as of 2014. Company Employees Microsoft 373 Intel 310 Apple 146 Samsung 126 Cisco 109 Send data to Excel Part: 0 / 2 Part 1 of 2 Construct a vertical bar graph for the data. Tech Company Employeesarrow_forwardA+ F3 # F a. What are the relative and absolute changes in the Charlie Card bus fare? You don't have to do this in your head, without a calculator, but you should be able to. b. Create a spreadsheet for these data, with eight rows (one for each of the eight categories) and three columns, for the category name, the existing fare and the proposed fare. Create a properly labeled bar graph to display the data. c. Label the next two columns appropriately to hold the relative and absolute changes. Fill those columns with Excel formulas to compute the correct values. Do not compute the values elsewhere and enter them in the spreadsheet as numbers. [See the back of the book for a hint.] F4 4 d. Imagine that you are addressing a public meeting about these fare increases. How would you argue that an unfair burden is being placed on people who pay using a Charlie Ticket? How would you argue that senior citizens are most hard hit? 2 (6 14 13) 3 nts - The table below shows the salarestructure of…arrow_forwardThe following data represents the prices of gasoline in the United States from 2004 to 2010. YEAR GAS PRICE 2004 $1.88 2005 $2.30 2006 $2.59 2007 $2.80 2008 $3.27 2009 $2.35 2010 $2.79 Construct a line graph as if you were a representative of the oil company. EXPLAIN THE REASONING for your construction. Construct a line graph as if you were representing a consumer advocacy group.…arrow_forward
arrow_back_ios
SEE MORE QUESTIONS
arrow_forward_ios
Recommended textbooks for you
 MATLAB: An Introduction with ApplicationsStatisticsISBN:9781119256830Author:Amos GilatPublisher:John Wiley & Sons Inc
 Probability and Statistics for Engineering and th...StatisticsISBN:9781305251809Author:Jay L. DevorePublisher:Cengage Learning
 Statistics for The Behavioral Sciences (MindTap C...StatisticsISBN:9781305504912Author:Frederick J Gravetter, Larry B. WallnauPublisher:Cengage Learning
 Elementary Statistics: Picturing the World (7th E...StatisticsISBN:9780134683416Author:Ron Larson, Betsy FarberPublisher:PEARSON
 The Basic Practice of StatisticsStatisticsISBN:9781319042578Author:David S. Moore, William I. Notz, Michael A. FlignerPublisher:W. H. Freeman
 Introduction to the Practice of StatisticsStatisticsISBN:9781319013387Author:David S. Moore, George P. McCabe, Bruce A. CraigPublisher:W. H. Freeman

MATLAB: An Introduction with Applications
Statistics
ISBN:9781119256830
Author:Amos Gilat
Publisher:John Wiley & Sons Inc

Probability and Statistics for Engineering and th...
Statistics
ISBN:9781305251809
Author:Jay L. Devore
Publisher:Cengage Learning

Statistics for The Behavioral Sciences (MindTap C...
Statistics
ISBN:9781305504912
Author:Frederick J Gravetter, Larry B. Wallnau
Publisher:Cengage Learning

Elementary Statistics: Picturing the World (7th E...
Statistics
ISBN:9780134683416
Author:Ron Larson, Betsy Farber
Publisher:PEARSON

The Basic Practice of Statistics
Statistics
ISBN:9781319042578
Author:David S. Moore, William I. Notz, Michael A. Fligner
Publisher:W. H. Freeman

Introduction to the Practice of Statistics
Statistics
ISBN:9781319013387
Author:David S. Moore, George P. McCabe, Bruce A. Craig
Publisher:W. H. Freeman