
MATLAB: An Introduction with Applications
6th Edition
ISBN: 9781119256830
Author: Amos Gilat
Publisher: John Wiley & Sons Inc
expand_more
expand_more
format_list_bulleted
Related questions
Question
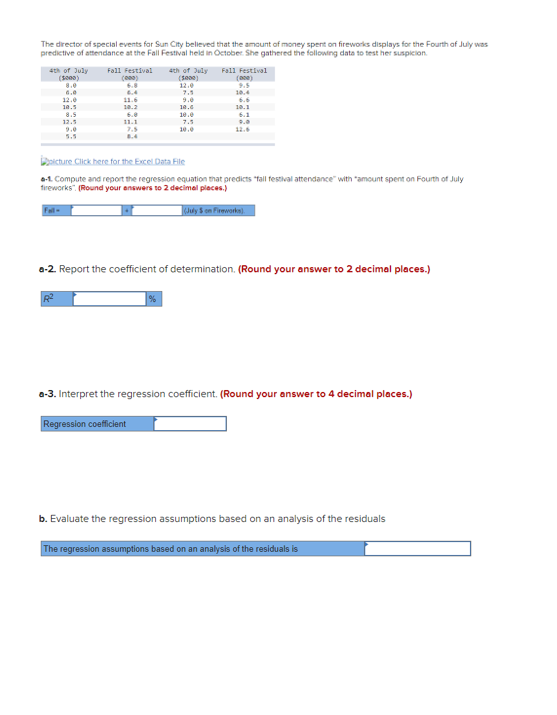

Transcribed Image Text:The director of special events for Sun City believed that the amount of money spent on fireworks displays for the Fourth of July was
predictive of attendance at the Fall Festival held in October. She gathered the following data to test her suspicion
4th of July
(5000)
8.0
6.0
12.0
10.5
8.5
12.5
9.0
Fall-
Fall Festival
(000)
18.2
6.8
11.1
4th of July
(5000)
12.0
10.6
10.0
7.5
Fall Festival
(000)
10.4
6.6
10.1
6.1
9.0
picture. Click here for the Excel Data File
e-1. Compute and report the regression equation that predicts "fall festival attendance" with "amount spent on Fourth of July
fireworks". (Round your answers to 2 decimal places.)
(July $ on Fireworks).
a-2. Report the coefficient of determination. (Round your answer to 2 decimal places.)
a-3. Interpret the regression coefficient. (Round your answer to 4 decimal places.)
Regression coefficient
b. Evaluate the regression assumptions based on an analysis of the residuals
The regression assumptions based on an analysis of the residuals is
Expert Solution
This question has been solved!
Explore an expertly crafted, step-by-step solution for a thorough understanding of key concepts.

This is a popular solution

Trending nowThis is a popular solution!

Step by stepSolved in 4 steps with 1 images

Knowledge Booster

Similar questions
- Mr. Palmer, has been teaching beginners how to fix their stroke for the last 10 years. The mean golfing score for all past students who learned with Mr. Palmer is 79. This golfing cycle, he tried a new teaching method using simulations instead of real-world golf. He then had 15 of his students that used his new method take a golfing test. Enter the data into SPSS. Use this dataset to answer this question: did Mr. Palmer’s students perform better on the golfing test using the new method as compared to the traditional teaching technique? 1. From the output, report the test statistic and the probability (obtained p-value, called “sig” in the output). Remember to include degrees of freedom when you report t-values. 2. Will you reject or fail to reject the null based on the SPSS output (Remember to use numbers from the output only to make your statistical conclusion. If you use a critical t, you will get no points.).arrow_forwardWrite the null and hypothesis for this test.arrow_forwardA researcher gathered a sample of participants who volunteered for a studying of phobias. She measured anxiety level of participants as they viewed photos of spiders and again when they viewed puppies. Which statistical test is appropriate for this study and why?arrow_forward
- Which of the following answers is correct and why? I really need an explanation for this question.arrow_forwardA school principal claims that the number of students who are tardy to school does not vary from month to month. A survey over the school year produced the following results. Using a 0.01 level of significance, test a teacher's claim that the number of tardy students does vary by the month. Number Aug. Oct. Sept. 18 13 19 Tardy Students Nov. Dec. Jan. 14 8 Feb. Mar. Apr. 6 13 11 15 May 16 Copy Data Step 2 of 4: Calculate the expected value for the number of tardies in October. Enter your answer as a fraction or a decimal rounded to three decimal places.arrow_forwardA school principal claims that the number of students who are tardy to school does not vary from month to month. A survey over the school year produced the following results. Using a 0.01 level of significance, test a teacher's claim that the number of tardy students does vary by the month. Number Aug. Sept. Oct. 18 13 19 Tardy Students Nov. 14 Dec. Jan. Feb. Mar. Apr. May 8 6 13 11 15 16 Copy Data Step 3 of 4: Compute the value of the test statistic. Round any intermediate calculations to at least six decimal places, and round your final answer to three decimal places.arrow_forward
- Please see below. Note that the answers shown are wrong.arrow_forwardPlease see below for the question details. I got 34.32 for the interest, but I also got 19.68 and 32 when I reworked the problem; Please help!!!! Because of the relatively high interest rates, most consumers attempt to pay off their credit card bills promptly. However, this is not always possible. An analysis of the amount of interest paid monthly by a bank's Visa cardholders reveals that the amount is normally distributed with a mean of 27 dollars and a standard deviation of 8 dollars.Please use z-scores with at least 3 decimal places. D. What interest payment is exceeded by only 18% of the bank's Visa cardholders? Interest Payment =arrow_forwardYou may need to use the appropriate appendix table or technology to answer this question. In a study entitled How Undergraduate Students Use Credit Cards, it was reported that undergraduate students have a mean credit card balance of $3,173. This figure was an all-time high and had increased 44% over the previous five years. Assume that a current study is being conducted to determine if it can be concluded that the mean credit card balance for undergraduate students has continued to increase compared to the original report. Based on previous studies, use a population standard deviation ? = $1,000. (a) State the null and alternative hypotheses. H0: ? < 3,173 Ha: ? ≥ 3,173 H0: ? = 3,173 Ha: ? ≠ 3,173 H0: ? > 3,173 Ha: ? ≤ 3,173 H0: ? ≥ 3,173 Ha: ? < 3,173 H0: ? ≤ 3,173 Ha: ? > 3,173 (b) What is the test statistic for a sample of 170 undergraduate students with a sample mean credit card balance of $3,305? (Round your answer to two decimal places.) What is…arrow_forward
- The U.S. Golf Association provides a number of services for its members. One of these is the evaluation of golf equipment to make sure that the equipment satisfies the rules of golf. For example, they regularly test the golf balls made by the various companies that sell balls in the United States. Recently they undertook a study of two brands of golf balls with the objective to see whether there is a difference in the mean distance that the two golf ball brands will fly off the tee. To conduct the test, the U.S.G.A. uses a robot named "ron Byron," which swings the club at the same speed and with the same swing pattern each time it is used. The following data reflect sample data for a random sample of balls of each brand.arrow_forwardA researcher hypothesizes that different colors of cars result in different average speeds. To test this claim, she took a random sample of 20 people who own 4 different colors of colors of cars (n = 20, N = 80, G = 4), and she then tracks their average speed on the highway for a week of driving. The following ANOVA table has some of her results. Please help her answer her research questions by completing the following ANOVA table below and answering the follow-up questions. Be sure to label your answers with the appropriate letter and show all your work! Source Sums of Squares df Mean Square F Effect (between) Error (within) 100.90 ------ Total 170.10 ------- ------ a) What is the Sums of Squares (SS) between (effect)? b) What are the Mean Square (MS) between (effect) and the MS within (error)? c) What are the degrees of freedom (df) between, the df within, and the df total? d) What is the overall F-statistic? e) Based on the…arrow_forwardA statistics content developer at Aplia wanted to know whether study skills are related to memory quality. She invited student volunteers to perform an online memory task. The students saw a list of 60 words and were then asked to recognize a list of 10 words that were on the original list. Students were also asked to provide their GPAs. Consider the following data set, which was collected from student volunteers in 2009. The table gives the frequency for five intervals of scores on the number of correctly identified words. Use the dropdown menus to complete the table by filling in the missing values for the proportions and percentages. Score Interval f Proportion Percentage 9–10 29 0.19 19% 7–8 53 5–6 50 3–4 22 0.14 14% 1–2 1 0.01 1%arrow_forward
arrow_back_ios
SEE MORE QUESTIONS
arrow_forward_ios
Recommended textbooks for you
- MATLAB: An Introduction with ApplicationsStatisticsISBN:9781119256830Author:Amos GilatPublisher:John Wiley & Sons Inc
 Probability and Statistics for Engineering and th...StatisticsISBN:9781305251809Author:Jay L. DevorePublisher:Cengage Learning
 Statistics for The Behavioral Sciences (MindTap C...StatisticsISBN:9781305504912Author:Frederick J Gravetter, Larry B. WallnauPublisher:Cengage Learning
  Elementary Statistics: Picturing the World (7th E...StatisticsISBN:9780134683416Author:Ron Larson, Betsy FarberPublisher:PEARSON
 The Basic Practice of StatisticsStatisticsISBN:9781319042578Author:David S. Moore, William I. Notz, Michael A. FlignerPublisher:W. H. Freeman
 Introduction to the Practice of StatisticsStatisticsISBN:9781319013387Author:David S. Moore, George P. McCabe, Bruce A. CraigPublisher:W. H. Freeman
MATLAB: An Introduction with Applications
Statistics
ISBN:9781119256830
Author:Amos Gilat
Publisher:John Wiley & Sons Inc
Probability and Statistics for Engineering and th...
Statistics
ISBN:9781305251809
Author:Jay L. Devore
Publisher:Cengage Learning
Statistics for The Behavioral Sciences (MindTap C...
Statistics
ISBN:9781305504912
Author:Frederick J Gravetter, Larry B. Wallnau
Publisher:Cengage Learning
Elementary Statistics: Picturing the World (7th E...
Statistics
ISBN:9780134683416
Author:Ron Larson, Betsy Farber
Publisher:PEARSON
The Basic Practice of Statistics
Statistics
ISBN:9781319042578
Author:David S. Moore, William I. Notz, Michael A. Fligner
Publisher:W. H. Freeman
Introduction to the Practice of Statistics
Statistics
ISBN:9781319013387
Author:David S. Moore, George P. McCabe, Bruce A. Craig
Publisher:W. H. Freeman