
MATLAB: An Introduction with Applications
6th Edition
ISBN: 9781119256830
Author: Amos Gilat
Publisher: John Wiley & Sons Inc
expand_more
expand_more
format_list_bulleted
Related questions
Question
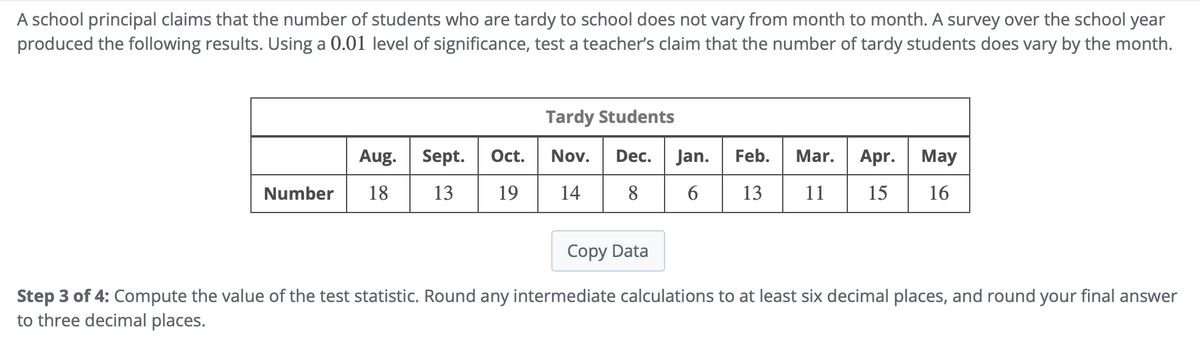

Transcribed Image Text:A school principal claims that the number of students who are tardy to school does not vary from month to month. A survey over the school year
produced the following results. Using a 0.01 level of significance, test a teacher's claim that the number of tardy students does vary by the month.
Number
Aug. Sept.
Oct.
18 13 19
Tardy Students
Nov.
14
Dec. Jan. Feb. Mar. Apr. May
8 6 13 11 15 16
Copy Data
Step 3 of 4: Compute the value of the test statistic. Round any intermediate calculations to at least six decimal places, and round your final answer
to three decimal places.
Expert Solution
This question has been solved!
Explore an expertly crafted, step-by-step solution for a thorough understanding of key concepts.

This is a popular solution

Trending nowThis is a popular solution!

Step by stepSolved in 3 steps with 1 images

Knowledge Booster

Similar questions
- Consider the following data set. Round your answers to the nearest hundredth as needed. 101 88 71 101 101 67 83 87 76 91 Mean = Median = Mode = Range Sample Standard Deviation =arrow_forwardPlease answer all thoroughly and clearly Grade 12 Data Managementarrow_forwardI need help with something regarding this problem. The National Sleep Foundation recommends that adults aged 18 to 64 get an average of 8 hours of sleep per night. A survey of sleep hours was taken during a Statistics class. The data is listed below: 4, 5, 5, 5, 5.5, 6, 6, 6, 6, 7, 7, 7, 7, 7, 7, 7, 8, 8, 8, 8, 9, 9, 9, 10, 10 Do we have enough evidence at the 0.05 significance level to say that statistics students tend to get less sleep than the recommended average of 8 hours per night? How would I get the degrees of freedom?arrow_forward
- The following set of data represents the number of orders filled by a national-chain restaurant during a two week period. Construct a five number summary for the the data. 66, 75, 68, 89, 86, 73, 67, 75, 75, 82, 85, 74, 67, 61 (Round to the nearest hundredth, if needed). Min _________________ Lower Quartile _________________ Median __________________ Upper Quartile _________________ Maximum __________________ What is the range and the interquartile range (IQR)? Range __________________ Interquartile Range (IQR) ___________________arrow_forwardGiven the following frequency table of values, is the mean or the median likely to be a better measure of the center of the data set? Value Frequency 21 2 42 3 43 8 46 7 49 3 51 1arrow_forward2. Given the following observations from a sample, calculate the mean, the median, and the mode. 4 0 -6 1 -3 -4arrow_forward
- The following refer to the following data set: 50.4 47.5 50.4 23.4 33.7 50.4 39.2 36.4 16.3 21.8 What is the arithmetic mean of this data set? mean = 37What is the median of this data set?median = 37.8What is the mode of this data set?mode = 50.4arrow_forwardConsider the following data set. Round your answers to the nearest hundredth as needed. 38 42 37 28 56 48 47 68 68 68 Mean = ___Median = ___Mode = ___Range = ___arrow_forwardPlease answers questions a through d. Thank you!arrow_forward
- Consider the following ordered data. 6 9 9 10 11 11 12 13 14 Find the low, Q1, median, Q3, and high.arrow_forwardThe second slide is the first part of the question and the first slide is the second part of the question.arrow_forwardThe mean number of sick days an employee takes per year is believed to be about 10.5. Members of a personnel department do not believe this figure. They randomly survey ten employees. The number of sick days they took for the past year are as follows: 12; 4; 15; 3; 11; 8; 6; 8; 2; 9. Let x = the number of sick days they took for the past year. Should the personnel team believe that the mean number is ten?arrow_forward
arrow_back_ios
SEE MORE QUESTIONS
arrow_forward_ios
Recommended textbooks for you
- MATLAB: An Introduction with ApplicationsStatisticsISBN:9781119256830Author:Amos GilatPublisher:John Wiley & Sons Inc
 Probability and Statistics for Engineering and th...StatisticsISBN:9781305251809Author:Jay L. DevorePublisher:Cengage Learning
 Statistics for The Behavioral Sciences (MindTap C...StatisticsISBN:9781305504912Author:Frederick J Gravetter, Larry B. WallnauPublisher:Cengage Learning
  Elementary Statistics: Picturing the World (7th E...StatisticsISBN:9780134683416Author:Ron Larson, Betsy FarberPublisher:PEARSON
 The Basic Practice of StatisticsStatisticsISBN:9781319042578Author:David S. Moore, William I. Notz, Michael A. FlignerPublisher:W. H. Freeman
 Introduction to the Practice of StatisticsStatisticsISBN:9781319013387Author:David S. Moore, George P. McCabe, Bruce A. CraigPublisher:W. H. Freeman
MATLAB: An Introduction with Applications
Statistics
ISBN:9781119256830
Author:Amos Gilat
Publisher:John Wiley & Sons Inc
Probability and Statistics for Engineering and th...
Statistics
ISBN:9781305251809
Author:Jay L. Devore
Publisher:Cengage Learning
Statistics for The Behavioral Sciences (MindTap C...
Statistics
ISBN:9781305504912
Author:Frederick J Gravetter, Larry B. Wallnau
Publisher:Cengage Learning
Elementary Statistics: Picturing the World (7th E...
Statistics
ISBN:9780134683416
Author:Ron Larson, Betsy Farber
Publisher:PEARSON
The Basic Practice of Statistics
Statistics
ISBN:9781319042578
Author:David S. Moore, William I. Notz, Michael A. Fligner
Publisher:W. H. Freeman
Introduction to the Practice of Statistics
Statistics
ISBN:9781319013387
Author:David S. Moore, George P. McCabe, Bruce A. Craig
Publisher:W. H. Freeman