
MATLAB: An Introduction with Applications
6th Edition
ISBN: 9781119256830
Author: Amos Gilat
Publisher: John Wiley & Sons Inc
expand_more
expand_more
format_list_bulleted
Related questions
Concept explainers
Question
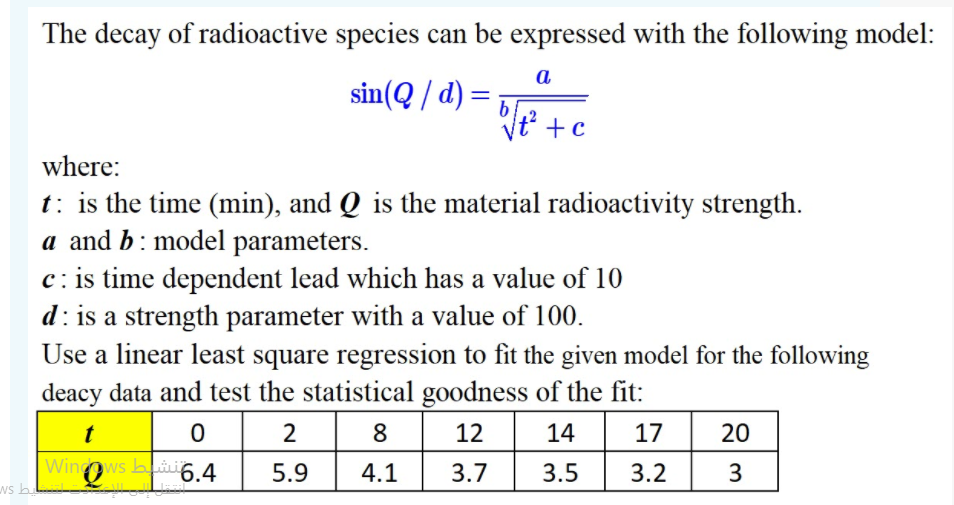

Transcribed Image Text:The decay of radioactive species can be expressed with the following model:
a
sin(Q / d) =
%3D
b
Vt +c
where:
t: is the time (min), and Q is the material radioactivity strength.
a and b: model parameters.
c: is time dependent lead which has a value of 10
d: is a strength parameter with a value of 100.
Use a linear least square regression to fit the given model for the following
deacy data and test the statistical goodness of the fit:
t
2
8
12
14
17
20
Wingows bu 6.4
ws b
5.9
4.1
3.7
3.5
3.2
3
Expert Solution
This question has been solved!
Explore an expertly crafted, step-by-step solution for a thorough understanding of key concepts.

Step by stepSolved in 2 steps with 2 images

Knowledge Booster


Learn more about
Need a deep-dive on the concept behind this application? Look no further. Learn more about this topic, statistics and related others by exploring similar questions and additional content below.Similar questions
- please answer correctly:arrow_forwardA researcher investigates the relationship between cigarette smoking (X) and work absences (Y). The number of cigarettes smoked daily and the number of days absent from work due to illness are collected for N= 12 employees. The preliminary results are below: What is the regression equation? How many absences (Y) would expect someone who smokes X = 10 cigarettes a day to have?arrow_forwardThe following table shows both current and projected data on the number, in millions, of Facebook users in a certain country. t = years since 2012 F = number of Facebookusers (millions) 0 9.7 1 10.5 2 10.8 3 12.2 4 13.1 5 13.2 6 13.8 (a) Plot the data. (b) Find the equation of the regression line. (Round regression line parameters to two decimal places.) F(t) = Add the graph of the regression line to the plot from part (a). (c) Explain in practical terms the meaning of the slope of the regression line. (Round your answers to two decimal places). The slope of the regression line is million users per year. The slope means that, from 2012 on, the number of Facebook users in the country is expected to increase by million each year.arrow_forward
- The table below shows the number of state-registered automatic weapons and the murder rate for several Northwestern states. xx 11.7 8.1 6.7 3.3 2.7 2.3 2.2 0.3 yy 13.8 10.7 9.9 6.6 6.1 5.9 6.1 4.5 xx = thousands of automatic weaponsyy = murders per 100,000 residents Determine the regression equation in y = ax + b form and write it below. (Round to 2 decimal places) A) How many murders per 100,000 residents can be expected in a state with 6.4 thousand automatic weapons? Answer = Round to 3 decimal places. B) How many murders per 100,000 residents can be expected in a state with 6.7 thousand automatic weapons? Answer = Round to 3 decimal places.arrow_forwardConsider the accompanying data on x = research and development expenditure (millions of dollars) and y = growth rate (% per year) for eight different industries. X 2.025 5.039 0.904 3.573 1.157 0.327 0.378 0.191 y 1.90 3.96 USE SALT 2.44 0.88 0.37 -0.9 0.49 1.01 (a) Would a simple linear regression model provide useful information for predicting growth rate from research and development expenditure? Test the appropriate hypotheses using a 0.05 significance level. Calculate the test statistic. (Round your answer to two decimal places.) t = Use technology to find the P-value for this test. (Round your answer to four decimal places.) P-value = What can you conclude? O Reject Ho. We do not have convincing evidence of a useful linear relationship between growth rate and research and development expenditure. O Fail to reject Ho. We do not have convincing evidence of a useful linear relationship between growth rate and research and development expenditure. O Fail to reject H. We have…arrow_forwardA residual plot from a simple linear regression analysis is shown to the right. Use the plot to answer the question below. residuals 0 X Which of the following statements regarding the plot is true? OA. The condition that the residuals are normally distributed is not met since not all of the residuals fall on the reference line in the residual plot. OB. The condition that the residuals have constant variation is met since the lines connecting the largest positive residuals and largest negative residuals are parallel. Oc. The condition that the residuals are normally distributed is not met since there is a diamond shape to the residuals in the residual plot. OD. The condition that the residuals have constant variation is not met since the variation increases and then decreases as x gets larger.arrow_forward
- The regression model Yi=−303.8+1.5949X1i−0.0699X2i predicts standby hours based on total staff present, X1i, and remote hours, X2i, for week i. The data from which the model was constructed are provided. b. If appropriate, perform the Durbin-Watson test, using α=0.05. Determine the Durbin-Watson statistic.arrow_forwardKeeping water supplies clean requires regular measurement of levels of pollutants. The measurements are indirect- a typical analysis involves forming a dye by a chemical reaction with the dissolved pollutant, then passing light through the solution and measuring its " absorbence." To calibrate such measurements, the laboratory measures known standard solutions and uses regression to relate absorbence and pollutant concentration. This is usually done every day. Here is one series of data on the absorbence for different levels of nitrates. Nitrates are measured in milligrams per liter of water. Nitrates 100 50 125 250 300 300 800 1400 1700 3800 Absorbance 5.8 7.3 13.9 20.9 49.6 92.6 142.8 185.5 203.6 236.1 Chemical theory says that these data should lie on a straight line. If the correlation is not at least 0.997, something went wrong and the calibration procedure is repeated. (a) Find the correlation r. r = (b) Must the calibration be done again? (Answer YES or…arrow_forwardA survey is conducted on 700 Californians older than 30 years of age. The study wants to obtain inference on the relationship between years of education and yearly income in dollars. The response variable is income in dollars and the explanatory variable is years of education. A simple linear regression model is fit, and the output from R is below: Im(formula = Income ~ Education, data = CA) Coefficients: Estimate Std. Error t value Pr(>|t|) (Intercept) 25200.25 1488.94 16.93 3.08e-10 *** Education 2905.35 112.61 25.80 1.49e-12 *** Residual standard error: 32400 on 698 degrees of freedom Multiple R-squared: 0.7602arrow_forward
arrow_back_ios
arrow_forward_ios
Recommended textbooks for you
- MATLAB: An Introduction with ApplicationsStatisticsISBN:9781119256830Author:Amos GilatPublisher:John Wiley & Sons Inc
 Probability and Statistics for Engineering and th...StatisticsISBN:9781305251809Author:Jay L. DevorePublisher:Cengage Learning
 Statistics for The Behavioral Sciences (MindTap C...StatisticsISBN:9781305504912Author:Frederick J Gravetter, Larry B. WallnauPublisher:Cengage Learning
  Elementary Statistics: Picturing the World (7th E...StatisticsISBN:9780134683416Author:Ron Larson, Betsy FarberPublisher:PEARSON
 The Basic Practice of StatisticsStatisticsISBN:9781319042578Author:David S. Moore, William I. Notz, Michael A. FlignerPublisher:W. H. Freeman
 Introduction to the Practice of StatisticsStatisticsISBN:9781319013387Author:David S. Moore, George P. McCabe, Bruce A. CraigPublisher:W. H. Freeman
MATLAB: An Introduction with Applications
Statistics
ISBN:9781119256830
Author:Amos Gilat
Publisher:John Wiley & Sons Inc
Probability and Statistics for Engineering and th...
Statistics
ISBN:9781305251809
Author:Jay L. Devore
Publisher:Cengage Learning
Statistics for The Behavioral Sciences (MindTap C...
Statistics
ISBN:9781305504912
Author:Frederick J Gravetter, Larry B. Wallnau
Publisher:Cengage Learning
Elementary Statistics: Picturing the World (7th E...
Statistics
ISBN:9780134683416
Author:Ron Larson, Betsy Farber
Publisher:PEARSON
The Basic Practice of Statistics
Statistics
ISBN:9781319042578
Author:David S. Moore, William I. Notz, Michael A. Fligner
Publisher:W. H. Freeman
Introduction to the Practice of Statistics
Statistics
ISBN:9781319013387
Author:David S. Moore, George P. McCabe, Bruce A. Craig
Publisher:W. H. Freeman