
MATLAB: An Introduction with Applications
6th Edition
ISBN: 9781119256830
Author: Amos Gilat
Publisher: John Wiley & Sons Inc
expand_more
expand_more
format_list_bulleted
Related questions
Question
thumb_up100%
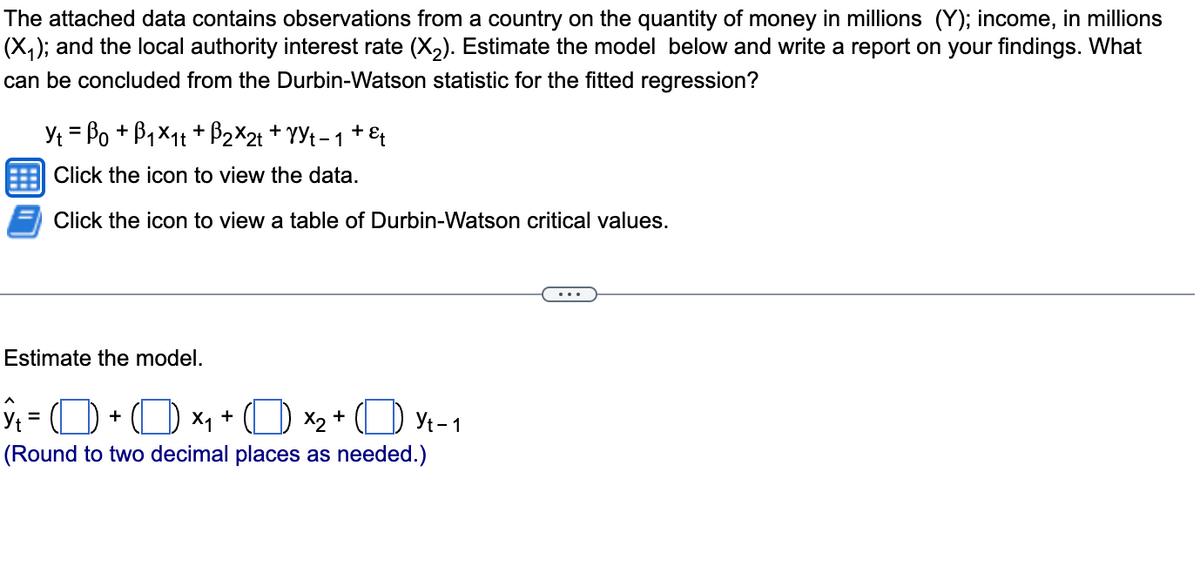

Transcribed Image Text:The attached data contains observations from a country on the quantity of money in millions (Y); income, in millions
(✗₁); and the local authority interest rate (X2). Estimate the model below and write a report on your findings. What
can be concluded from the Durbin-Watson statistic for the fitted regression?
=
YtBo+B1x1t+B2×2+ + Yyt− 1 + εt
Click the icon to view the data.
Click the icon to view a table of Durbin-Watson critical values.
Estimate the model.
ŷ₁ = 0 + 0 ×₁ + (1)×2 + (1) Yt-1
(Round to two decimal places as needed.)
...
Expert Solution
This question has been solved!
Explore an expertly crafted, step-by-step solution for a thorough understanding of key concepts.

Step by stepSolved in 2 steps with 2 images

Knowledge Booster

Similar questions
- Provide an appropriate response. Based on findings from the Health and Nutrition Examination Survey conducted by the National Center for Health Statistics from April 1971 to June 1974, tF regression equation predicting the average weight of a male aged 18-24 (y) based on his height (x) is given by y = -172.63 + 4.842x. (www.cdc.gov/nchs/da alad/ad014acc.pdf) What is the best prediction for the weight of a male aged 18-24 who is 68 inches tall? Round your answer to the nearest pound. O 173 lb. O 68 in. O 157 lb. O 166 lb.arrow_forward• When fitting a linear regression, multiple regression lines may be equally as good to represent the data. True O Falsearrow_forwardCan brand, battery life, and internal storage capacity affect a smartphone's price? Use MegaStat and α = .05 to perform a regression analysis for the Smartphones01BS dataset and answer the following questions. When you copy and paste output from MegaStat to answer a question, remember to choose to "Keep Formatting" to paste the text.arrow_forward
- I couldn't include the options for the graphs because it only allows me to add two pictures.arrow_forwardThe data show The chest size and weight of several bears find regression equation, letting chest size be the independent variable then find the best predicted weight of a bear with a chest size of 51 inches is the result close to the actual weight of 422 pounds use a significance level of 0.05 Chest size : 45, 50, 43, 43, 52, 52. Weight : 352, 374, 275, 314, 440, 367.arrow_forwardUsing your dataset, run a regression of Y=GPA and X=# Friends.(do not need your actual data, just the regression results)a) State what this regression is attempting to analyze. “By running this regression, we areattempting to show.....”b) Write out the regression equation and describe what it shows (if Friends increase by 1, then. . . ).c) Find your hypothesized GPA when the # friends equals 17.d) Is the slope of # of Friends significantly different from zero?Include Ho, Ha, decision rule, t statistic from table, tc, decision, and conclusion.e) Is the r-squared of # of Friends significantly different from zero?Include Ho, Ha, decision rule, F statistic from table, Fc, decision, and conclusion.arrow_forward
- In a fisheries researchers experiment the correlation between the number of eggs in tge nest and the number of viable (surviving ) eggs for a sample of nests is r=0.67 the equation of the regression line for number of viable eggs y versus number of eggs in the nest x is y =0.72x + 17.07 for a nest with 140 eggs what is the predicted number of viable eggs ?arrow_forwardi submitted a picture of the questionarrow_forward
arrow_back_ios
arrow_forward_ios
Recommended textbooks for you
- MATLAB: An Introduction with ApplicationsStatisticsISBN:9781119256830Author:Amos GilatPublisher:John Wiley & Sons Inc
 Probability and Statistics for Engineering and th...StatisticsISBN:9781305251809Author:Jay L. DevorePublisher:Cengage Learning
 Statistics for The Behavioral Sciences (MindTap C...StatisticsISBN:9781305504912Author:Frederick J Gravetter, Larry B. WallnauPublisher:Cengage Learning
  Elementary Statistics: Picturing the World (7th E...StatisticsISBN:9780134683416Author:Ron Larson, Betsy FarberPublisher:PEARSON
 The Basic Practice of StatisticsStatisticsISBN:9781319042578Author:David S. Moore, William I. Notz, Michael A. FlignerPublisher:W. H. Freeman
 Introduction to the Practice of StatisticsStatisticsISBN:9781319013387Author:David S. Moore, George P. McCabe, Bruce A. CraigPublisher:W. H. Freeman
MATLAB: An Introduction with Applications
Statistics
ISBN:9781119256830
Author:Amos Gilat
Publisher:John Wiley & Sons Inc
Probability and Statistics for Engineering and th...
Statistics
ISBN:9781305251809
Author:Jay L. Devore
Publisher:Cengage Learning
Statistics for The Behavioral Sciences (MindTap C...
Statistics
ISBN:9781305504912
Author:Frederick J Gravetter, Larry B. Wallnau
Publisher:Cengage Learning
Elementary Statistics: Picturing the World (7th E...
Statistics
ISBN:9780134683416
Author:Ron Larson, Betsy Farber
Publisher:PEARSON
The Basic Practice of Statistics
Statistics
ISBN:9781319042578
Author:David S. Moore, William I. Notz, Michael A. Fligner
Publisher:W. H. Freeman
Introduction to the Practice of Statistics
Statistics
ISBN:9781319013387
Author:David S. Moore, George P. McCabe, Bruce A. Craig
Publisher:W. H. Freeman