
MATLAB: An Introduction with Applications
6th Edition
ISBN: 9781119256830
Author: Amos Gilat
Publisher: John Wiley & Sons Inc
expand_more
expand_more
format_list_bulleted
Related questions
Question
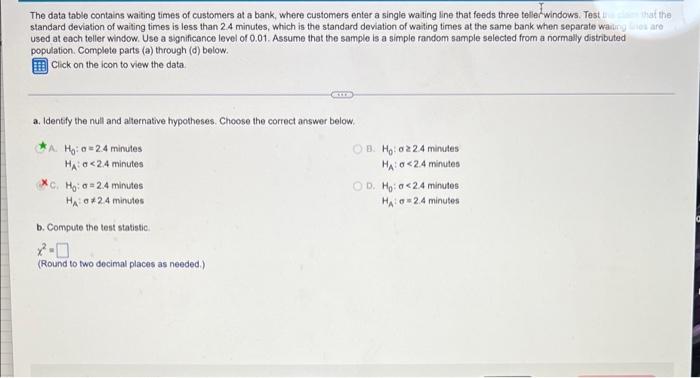

Transcribed Image Text:The data table contains waiting times of customers at a bank, where customers enter a single waiting line that feeds three tellerwindows. Test
standard deviation of waiting times is less than 2.4 minutes, which is the standard deviation of waiting times at the same bank when separate waiurng es are
used at each teller window. Use a significance level of 0.01. Assume that the sample is a simple random sample selected from a normally distributed
population. Complete parts (a) through (d) below.
E Click on the icon to view the data.
that the
a. Identify the null and alternative hypotheses. Choose the correct answer below.
A. Hg: a=24 minutes
HA o<24 minutes
OB. Ho: o2 24 minutes
HAa<24 minutes
C. Hg: a = 2.4 minutes
O D. Ho: a<24 minutes
HAo24 minutes
HA o424 minutes
b. Compute the test statistic.
(Round to two decimal places as needed.)

Transcribed Image Text:Customer Waiting Times
(in minutes)
8.9
6.2
7.1
7.1
6.4
7.8
7.1
7.7
7.8
6.6
8.2
6.6
6.7
7.2
7.6
7.3
7.5
6.3
5.3
7.7
7.9
8.9
7.5
6.1
6.2
8.2
7.3
8.3
6.4
7.9
6.2
7.9
8.8
8.8
6.7
7.5
6.4
7.8
6.6
7.2
7.5
6.8
5.4
7.6
8.3
6.3
8.7
7.8
8.3
7.1
7.5
6.2
6.4
6.3
7.9
7.9
6.5
7.2
6.7
7.6
Expert Solution
This question has been solved!
Explore an expertly crafted, step-by-step solution for a thorough understanding of key concepts.

Step by stepSolved in 3 steps with 2 images

Knowledge Booster

Similar questions
- To compare the dry braking distances from 30 to 0 miles per hour for two makes of automobiles, a safety engineer conducts braking tests for 35 models of Make A and 35 models of Make B. The mean braking distance for Make A is 42 feet. Assume the population standard deviation is 4.7 feet. The mean braking distance for Make B is 45 feet. Assume the population standard deviation is 4.4 feet. At a = 0.10, can the engineer support the claim that the mean braking distances are different for the two makes of automobiles? Assume the samples are random and independent, and the populations are normally distributed. Complete parts (a) rari rz (b) Find the critical value(s) and identify the rejection region(s). The critical value(s) is/are (Round to three decimal places as needed. Use a comma to separate answers as needed.)arrow_forwardWith a mean of 10 and standard deviation of 5. Assume that the population data are normally distributed. Calculate the z-score for a raw score of 5. What proportion of the distribution is equal to or less than this score?arrow_forwardFor a certain type of computers, the length of time between charges of the battery is normally distributed with a mean of 62 hours and a standard deviation of 11 hours. John owns one of these computers and wants to know the number of hours when the computer would have 12% of its battery life left. Sketch the region in question. Write a sentence describing what your answer represents about the problem's specefics.arrow_forward
- The distribution of the student heights at a large college is approximately bell shaped. If the mean height is 66 inches,and approximately 95% of the heights fall between 32 and 100 inches, then, the standard deviation of the heightdistribution is approximately equal toarrow_forwardThe tread life of a particular brand of tire is a random variable best described by a normal distribution with a mean of 60,000 miles and a standard deviation of 2700 miles. What warranty should the company use if they want 96% of the tires to outlast the warranty?arrow_forwardA reading class can read an mean of 175 words per minute and a population standard deviation of 20 words per minutes. The top 3% of the class is to receive a special award for a random sample of 49 students. What is the minimum average number of words per minute a student would need to read in order to get the award for a random sample of 49 students? Assume the data is normally distributed.arrow_forward
- A random sample of 18 light bulbs is drawn from a normally distributed population. The population has mean and standard deviation are 517 hours and 39 hours, respectively. What is the mean of the sampling distribution the sample mean?arrow_forwardhe average amount of time boys and girls spend playing sports each week is believed to be the same. A sample of equal size n is taken from boys and girls , the mean of the boys is 29 hours with standard deviation 4 hours and the mean of the girls is 27 hours with standard deviation 3 hours Both populations have a normal distribution. The calculated value is 1.2 n =arrow_forward
arrow_back_ios
arrow_forward_ios
Recommended textbooks for you
- MATLAB: An Introduction with ApplicationsStatisticsISBN:9781119256830Author:Amos GilatPublisher:John Wiley & Sons Inc
 Probability and Statistics for Engineering and th...StatisticsISBN:9781305251809Author:Jay L. DevorePublisher:Cengage Learning
 Statistics for The Behavioral Sciences (MindTap C...StatisticsISBN:9781305504912Author:Frederick J Gravetter, Larry B. WallnauPublisher:Cengage Learning
  Elementary Statistics: Picturing the World (7th E...StatisticsISBN:9780134683416Author:Ron Larson, Betsy FarberPublisher:PEARSON
 The Basic Practice of StatisticsStatisticsISBN:9781319042578Author:David S. Moore, William I. Notz, Michael A. FlignerPublisher:W. H. Freeman
 Introduction to the Practice of StatisticsStatisticsISBN:9781319013387Author:David S. Moore, George P. McCabe, Bruce A. CraigPublisher:W. H. Freeman
MATLAB: An Introduction with Applications
Statistics
ISBN:9781119256830
Author:Amos Gilat
Publisher:John Wiley & Sons Inc
Probability and Statistics for Engineering and th...
Statistics
ISBN:9781305251809
Author:Jay L. Devore
Publisher:Cengage Learning
Statistics for The Behavioral Sciences (MindTap C...
Statistics
ISBN:9781305504912
Author:Frederick J Gravetter, Larry B. Wallnau
Publisher:Cengage Learning
Elementary Statistics: Picturing the World (7th E...
Statistics
ISBN:9780134683416
Author:Ron Larson, Betsy Farber
Publisher:PEARSON
The Basic Practice of Statistics
Statistics
ISBN:9781319042578
Author:David S. Moore, William I. Notz, Michael A. Fligner
Publisher:W. H. Freeman
Introduction to the Practice of Statistics
Statistics
ISBN:9781319013387
Author:David S. Moore, George P. McCabe, Bruce A. Craig
Publisher:W. H. Freeman