MATLAB: An Introduction with Applications
6th Edition
ISBN: 9781119256830
Author: Amos Gilat
Publisher: John Wiley & Sons Inc
expand_more
expand_more
format_list_bulleted
Question

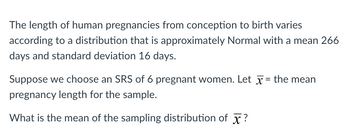
Transcribed Image Text:The length of human pregnancies from conception to birth varies
according to a distribution that is approximately Normal with a mean 266
days and standard deviation 16 days.
Suppose we choose an SRS of 6 pregnant women. Let x = the mean
pregnancy length for the sample.
What is the mean of the sampling distribution of X?
Expert Solution
arrow_forward
Step 1
Given that
Mean =266
Population standard deviation =16
Sample size n=6
Trending nowThis is a popular solution!
Step by stepSolved in 2 steps

Knowledge Booster
Similar questions
- According to Our World in Data, male heights follow a normal distribution with µ =178.4 cm and o= 7.6 cm. What is the 99th percentile height for men? Select the correct Excel command. =NORM.DIST(0.99, 178.4, 7.6) =NORM.INV(0.99, 178.4, 7.6) =NORM.INV(1-0.99, 178.4, 7.6) =NORM.DIST(1-0.99, 178.4, 7.6)arrow_forwardConsider the following game of chance based on the spinner below:Each spin costs $2. If the spinner lands on D the player wins $7, if the spinner stops on C the player wins a dime otherwise the player wins nothing. Calculate the players expected winnings. Express your answer to at least three decimal places in dollar form.arrow_forwardAssume that the number of days from conception to birth is normally distributed with a mean of 271 days and a standard deviation of 4 days. We want to calculate percentage of pregnancies last more than 34 weeks (238 days). What would be the z-score associated with 34 weeks (238 days)? -8.2 O 127.2 O 8.2 O -16.5 O 254.5arrow_forward
- What is the SD of a distribution if the mean is 4.5 and a z score of 3.5 corresponds to a raw score of 15?arrow_forwardSuppose that the lengths of pregnancies are normally distributed with a mean of 271 days and a standard deviation of 10 days. find the percentage of pregnancies that are longer than 254 days. For your intermediate computations, use four or more decimal places. Give your final answer to two decimal places (for example 98.23%).arrow_forwardAssume the average amount of caffeine consumed daily by adults is normally distributed with a mean of 260 mg and a standard deviation of 48 mg. In a random sample of 600 adults, how many consume at least 320 mg of caffeine daily?arrow_forward
- Use the 95% rule and the fact that the summary statistics come from a distribution that is symmetric and bell-shaped to find an interval that is expected to contain about 95% of the data values.A bell-shaped distribution with mean 220 and standard deviation 24.The interval is to .arrow_forwardAssume that IQ scores follow a Normal distribution with µ=100 and σ=16. Using our IQR rule for determining IQ score outliers, what IQ scores would establish the lower and upper fences for determining outliers?arrow_forwardHow many adults must be randomly selected to estimate the mean FICO (credit rating) score of working adults in the United States. We want 99% confidence that the sample mean is within 3 points of the population mean. Assume that the population standard deviation is 68.arrow_forward
- Marks obtained by students in an examination follow the normal distribution. If 30% of students got below 35 marks and 10% got above 60 marks. Find mean and standard deviation?arrow_forwardAcorns in the northern Atlantic regions of the U. S. have an average volume of 3.75 cubic centimeters, with a standard deviation of .85 centimeters. If we were to collect 1000 samples of 300 randomly-selected acorns, describe the sampling distribution for the sample mean of acorn volumes. Round to the nearest hundredth (two decimal places) if necessary. Shape: Center: Spread:arrow_forwardA random sample of 18 light bulbs is drawn from a normally distributed population. The population has mean and standard deviation are 517 hours and 39 hours, respectively. What is the mean of the sampling distribution the sample mean?arrow_forward
arrow_back_ios
SEE MORE QUESTIONS
arrow_forward_ios
Recommended textbooks for you
 MATLAB: An Introduction with ApplicationsStatisticsISBN:9781119256830Author:Amos GilatPublisher:John Wiley & Sons Inc
 Probability and Statistics for Engineering and th...StatisticsISBN:9781305251809Author:Jay L. DevorePublisher:Cengage Learning
 Statistics for The Behavioral Sciences (MindTap C...StatisticsISBN:9781305504912Author:Frederick J Gravetter, Larry B. WallnauPublisher:Cengage Learning
 Elementary Statistics: Picturing the World (7th E...StatisticsISBN:9780134683416Author:Ron Larson, Betsy FarberPublisher:PEARSON
 The Basic Practice of StatisticsStatisticsISBN:9781319042578Author:David S. Moore, William I. Notz, Michael A. FlignerPublisher:W. H. Freeman
 Introduction to the Practice of StatisticsStatisticsISBN:9781319013387Author:David S. Moore, George P. McCabe, Bruce A. CraigPublisher:W. H. Freeman

MATLAB: An Introduction with Applications
Statistics
ISBN:9781119256830
Author:Amos Gilat
Publisher:John Wiley & Sons Inc

Probability and Statistics for Engineering and th...
Statistics
ISBN:9781305251809
Author:Jay L. Devore
Publisher:Cengage Learning

Statistics for The Behavioral Sciences (MindTap C...
Statistics
ISBN:9781305504912
Author:Frederick J Gravetter, Larry B. Wallnau
Publisher:Cengage Learning

Elementary Statistics: Picturing the World (7th E...
Statistics
ISBN:9780134683416
Author:Ron Larson, Betsy Farber
Publisher:PEARSON

The Basic Practice of Statistics
Statistics
ISBN:9781319042578
Author:David S. Moore, William I. Notz, Michael A. Fligner
Publisher:W. H. Freeman

Introduction to the Practice of Statistics
Statistics
ISBN:9781319013387
Author:David S. Moore, George P. McCabe, Bruce A. Craig
Publisher:W. H. Freeman