
MATLAB: An Introduction with Applications
6th Edition
ISBN: 9781119256830
Author: Amos Gilat
Publisher: John Wiley & Sons Inc
expand_more
expand_more
format_list_bulleted
Related questions
Concept explainers
Question
thumb_up100%
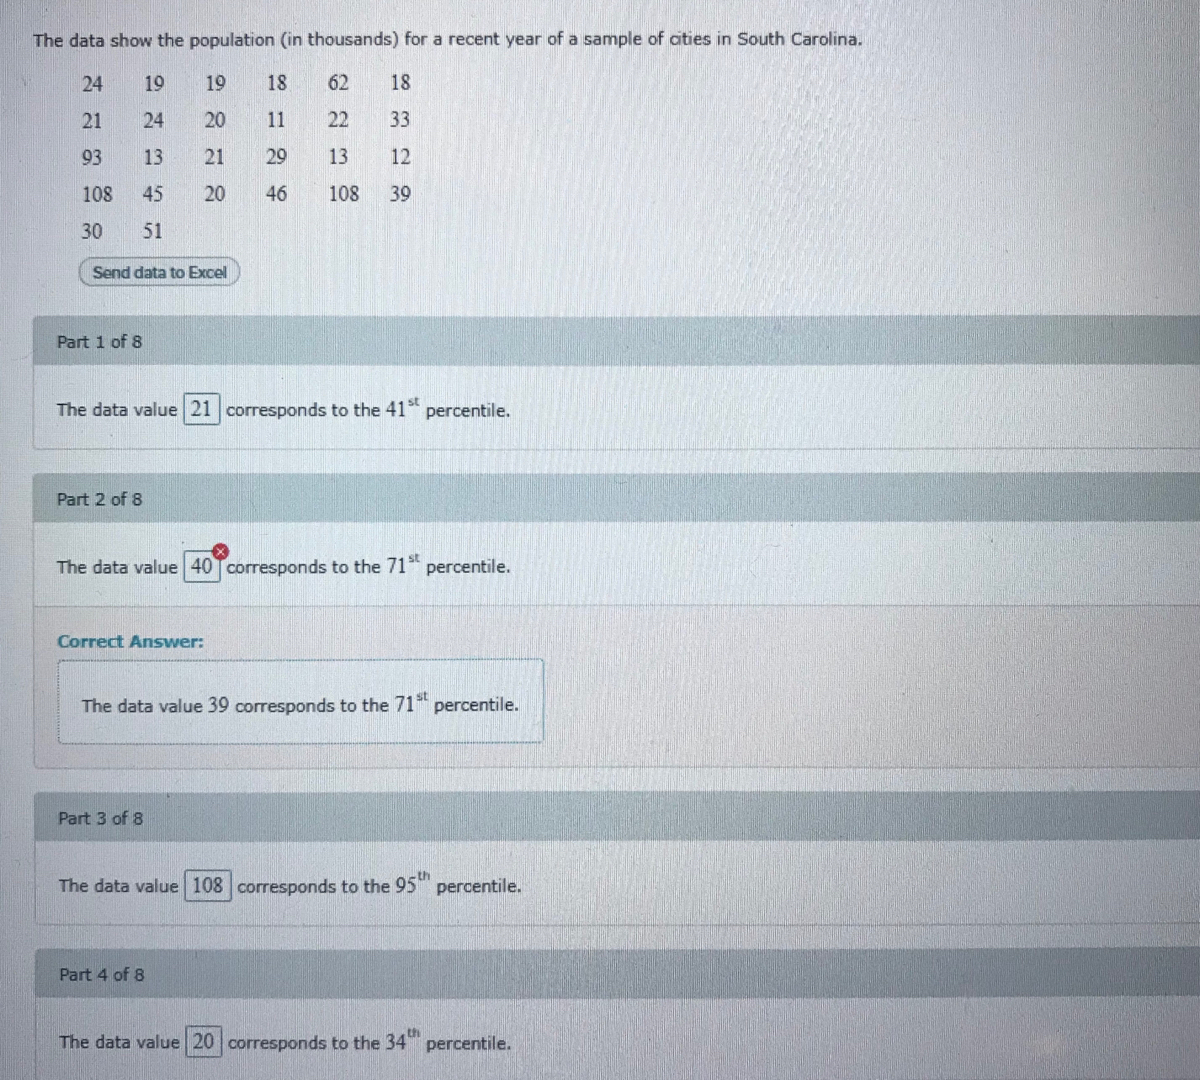

Transcribed Image Text:The data show the population (in thousands) for a recent year of a sample of cities in South Carolina.
24
19
19
18
62
18
21
24
20
11
22
33
93
13
21
29
13
12
108
45
20
46
108
39
30
51
Send data to Excel
Part 1 of 8
The data value 21 corresponds to the 41t
percentile.
Part 2 of 8
The data value 40 Tcorresponds to the 71 percentile.
Correct Answer:
The data value 39 corresponds to the 71 percentile.
Part 3 of 8
-th
The data value 108 corresponds to the 95 percentile.
Part 4 of 8
The data value 20 corresponds to the 34
percentile.

Transcribed Image Text:Part 4 of 8
The data value 20 corresponds to the 34" percentile.
th
Part 5 of 8
The percentile corresponding to the data value 22 is 21
Correct Answer:
The percentile corresponding to the data value 22 is 48.
Part 6 of 8
The percentile corresponding to the data value 45 is 108
Correct Answer:
The percentile corresponding to the data value 45 is 75.
Part: 6 / 8
Part 7 of 8
The percentile corresponding to the data value 51 is
Expert Solution
This question has been solved!
Explore an expertly crafted, step-by-step solution for a thorough understanding of key concepts.

This is a popular solution

Trending nowThis is a popular solution!

Step by stepSolved in 3 steps

Knowledge Booster


Learn more about
Need a deep-dive on the concept behind this application? Look no further. Learn more about this topic, statistics and related others by exploring similar questions and additional content below.Similar questions
- Find the 5 number summary for the data shown 13 24 27 28 38 45 46 48 52 78 84 90 5 number summary: Use the Locator/Percentile method described in your book, not your calculator. Add Work Check Answerarrow_forwardThe scores and the percents of the final grade for a student in a stats class are given. What is the student's mean score? Complete the thirds columnarrow_forwardFind the 5 number summary for the data shown 17 21 29 30 36 42 56 60 88 91 94 97 5 number summary:Use the Locator/Percentile method described in your book, not your calculator.arrow_forward
- R A veterinarian recorded how many kittens were born in each litter. This data is summarized in the L histogram below. (Note: The last class actually represents "7 or more kittens," not just 7 kittens.) 14 12 10- 8- 6- 4 1 2 3 4 7 8 # of kittens What is the frequency of litters having at most 3 kittens? ans = Fe Ro 1 FEB 18 P. W MacBook Air 20 000 esc F5 F6 F2 F3 F4 F1 & ! @ 1 2 4 5 Q W R %24 # 3 6 2. Frequencyarrow_forwardThe following stem-and-leaf plot represents the prices in dollars of general admission tickets for the last 18 concerts at one venue. Use the data provided to find the quartiles. Ticket Prices in Dollars Stem Leaves 4. 1 3 468 0 4 1 1 2 2 3 4 5 6 1 7 9 Key: 4|1 = 41 Copy Data Step 3 of 3: Find the third quartile. Answer 田 Tables Keypad How to enter your answer Keyboard Shortcuts Submit Answer ©2021 Hawkes Learning 67arrow_forwardFifty randomly selected car salespersons were asked the number of cars they generally sell in one week. Nine people answered that they generally sell three cars; thirteen generally sell four cars; ten generally sell five cars; seven generally sell six cars; eleven generally sell seven cars. Complete the table. Data Value (# cars) Frequency Relative Frequency Cumulative Relative Frequency 3 4 6. 7arrow_forward
- The data showed the population thousand for a recent year of a sample of citizen South Carolina the data value blank corresponds to the 46% 26 26 15 29 69 21 30 29 13 26 20 38 85 19 19 23 29 25 111 47 30 49 108 30 38arrow_forwardDetermine the mean of the data.arrow_forwardConsider the following data set: 38 24 32 18 25 Find the 36th percentile for this data. 36th percentile =arrow_forward
arrow_back_ios
arrow_forward_ios
Recommended textbooks for you
- MATLAB: An Introduction with ApplicationsStatisticsISBN:9781119256830Author:Amos GilatPublisher:John Wiley & Sons Inc
 Probability and Statistics for Engineering and th...StatisticsISBN:9781305251809Author:Jay L. DevorePublisher:Cengage Learning
 Statistics for The Behavioral Sciences (MindTap C...StatisticsISBN:9781305504912Author:Frederick J Gravetter, Larry B. WallnauPublisher:Cengage Learning
  Elementary Statistics: Picturing the World (7th E...StatisticsISBN:9780134683416Author:Ron Larson, Betsy FarberPublisher:PEARSON
 The Basic Practice of StatisticsStatisticsISBN:9781319042578Author:David S. Moore, William I. Notz, Michael A. FlignerPublisher:W. H. Freeman
 Introduction to the Practice of StatisticsStatisticsISBN:9781319013387Author:David S. Moore, George P. McCabe, Bruce A. CraigPublisher:W. H. Freeman
MATLAB: An Introduction with Applications
Statistics
ISBN:9781119256830
Author:Amos Gilat
Publisher:John Wiley & Sons Inc
Probability and Statistics for Engineering and th...
Statistics
ISBN:9781305251809
Author:Jay L. Devore
Publisher:Cengage Learning
Statistics for The Behavioral Sciences (MindTap C...
Statistics
ISBN:9781305504912
Author:Frederick J Gravetter, Larry B. Wallnau
Publisher:Cengage Learning
Elementary Statistics: Picturing the World (7th E...
Statistics
ISBN:9780134683416
Author:Ron Larson, Betsy Farber
Publisher:PEARSON
The Basic Practice of Statistics
Statistics
ISBN:9781319042578
Author:David S. Moore, William I. Notz, Michael A. Fligner
Publisher:W. H. Freeman
Introduction to the Practice of Statistics
Statistics
ISBN:9781319013387
Author:David S. Moore, George P. McCabe, Bruce A. Craig
Publisher:W. H. Freeman