
MATLAB: An Introduction with Applications
6th Edition
ISBN: 9781119256830
Author: Amos Gilat
Publisher: John Wiley & Sons Inc
expand_more
expand_more
format_list_bulleted
Related questions
Concept explainers
Topic Video
Question
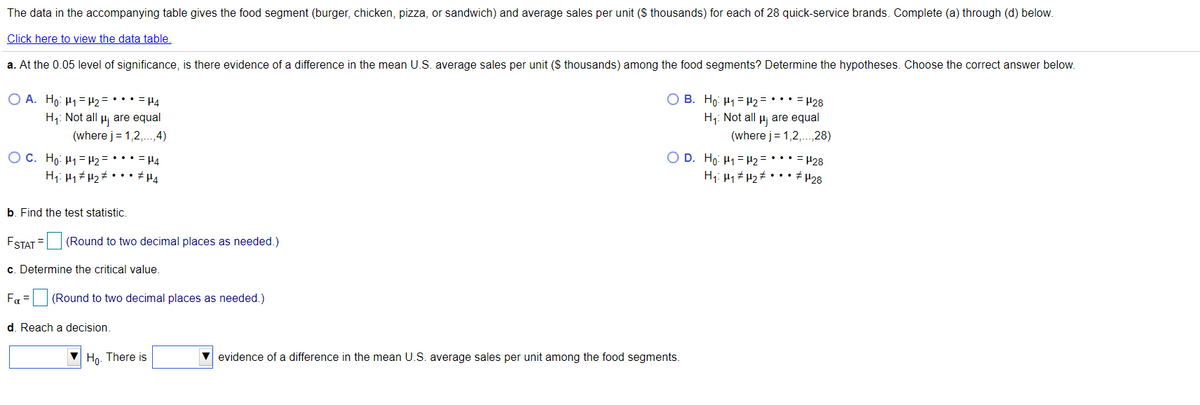

Transcribed Image Text:The data in the accompanying table gives the food segment (burger, chicken, pizza, or sandwich) and average sales per unit ($ thousands) for each of 28 quick-service brands. Complete (a) through (d) below.
Click here to view the data table,
a. At the 0.05 level of significance, is there evidence of a difference in the mean U.S. average sales per unit ($ thousands) among the food segments? Determine the hypotheses. Choose the correct answer below.
O A. Ho: H1= H2 = ••• = H4
H1: Not all Hj are equal
(where j= 1,2,..,4)
O B. Ho: H1= H2 = ••: = H28
H1: Not all H are equal
(where j= 1,2,.,28)
O C. Ho: H1= H2 = • • • = H4
H1: µ1 H2 ••• +4
O D. Ho: H1 = µ2 = • • • = H28
H1: H1 H2# ••• µ28
b. Find the test statistic.
ESTAT = (Round to two decimal places as needed.)
c. Determine the critical value.
Fa = (Round to two decimal places as needed.)
d. Reach a decision.
Hn. There is
V evidence of a difference in the mean U.S. average sales per unit among the food segments.

Transcribed Image Text:Burger
Chicken
Pizza
Sandwich
2512
2823
1301
482
1520
965
872
2457
1185
1281
646
932
1309
1734
2596
873
1422
733
1133
366
2144
1281
213
2405
1260
986
724
893
Expert Solution
This question has been solved!
Explore an expertly crafted, step-by-step solution for a thorough understanding of key concepts.

This is a popular solution

Trending nowThis is a popular solution!

Step by stepSolved in 2 steps with 5 images

Knowledge Booster


Learn more about
Need a deep-dive on the concept behind this application? Look no further. Learn more about this topic, statistics and related others by exploring similar questions and additional content below.Similar questions
- In a typical set of numerical data, what fraction of the data values lie above Q3?arrow_forwardWhat is the difference between relative frequency and cumulative frequency? Choose the correct answer below. A. Relative frequency of a class is the number of observations in that class, while cumulative frequency of a class is the sum of all the frequencies. B. Relative frequency of a class is the proportion of the data in that class, while cumulative frequency of a class is the number of observations in that class. C. Relative frequency of a class is the percentage of the data that falls in that class, while cumulative frequency of a class is the sum of the frequencies of that class and all previous classes. O D. There is no difference between the two.arrow_forwardWhy the number of days spent in hospital is a data measured at an interval and not ordinal level?arrow_forward
- Is the following nominal, ordinal, or interval data? Explain your answer. Stock pricesarrow_forwardUsing the same data and information. Please answer this: Should you be encouraging or discouraging credit card sales? In answering this question, consider the following: Is the proportion of credit and non-credit sales significantly different? (a=.05) Is the average sale amount for credit sales different than the average sales amount for non-credit sales? (a=.05)arrow_forwardThe following refer to the following data set: 24 35 98 30 91 40 93 40 57 39 What is the mean () of this data set? mean = (Please show your answer to one decimal place.) What is the median of this data set? median = What is the mode of this data set? mode =arrow_forward
- The table contains data on the admission price (in dollars) for one-day tickets to 10 theme parks in the United States. Find the interquartile range for this data set. 57 61 43 42 30 49 62 40 37 40arrow_forwardListed below are the measured radiation emissions (in W/kg) corresponding to cell phones: A, B, C, D, E, F, G, H, I, J, and K respectively. The media often present reports about the dangers of cell phone radiation as a cause of cancer. Cell phone radiation must be 1.6 W/kg or less. Find the a. mean, b. median, c. midrange, and d. mode for the data. Also complete part e. 0.45 0.77 0.72 0.68 1.53 1.28 0.75 0.99 0.55 0.56 1.12 --..- a. Find the mean. The mean is . (Round to three decimal places as needed.)arrow_forward
arrow_back_ios
arrow_forward_ios
Recommended textbooks for you
- MATLAB: An Introduction with ApplicationsStatisticsISBN:9781119256830Author:Amos GilatPublisher:John Wiley & Sons Inc
 Probability and Statistics for Engineering and th...StatisticsISBN:9781305251809Author:Jay L. DevorePublisher:Cengage Learning
 Statistics for The Behavioral Sciences (MindTap C...StatisticsISBN:9781305504912Author:Frederick J Gravetter, Larry B. WallnauPublisher:Cengage Learning
  Elementary Statistics: Picturing the World (7th E...StatisticsISBN:9780134683416Author:Ron Larson, Betsy FarberPublisher:PEARSON
 The Basic Practice of StatisticsStatisticsISBN:9781319042578Author:David S. Moore, William I. Notz, Michael A. FlignerPublisher:W. H. Freeman
 Introduction to the Practice of StatisticsStatisticsISBN:9781319013387Author:David S. Moore, George P. McCabe, Bruce A. CraigPublisher:W. H. Freeman
MATLAB: An Introduction with Applications
Statistics
ISBN:9781119256830
Author:Amos Gilat
Publisher:John Wiley & Sons Inc
Probability and Statistics for Engineering and th...
Statistics
ISBN:9781305251809
Author:Jay L. Devore
Publisher:Cengage Learning
Statistics for The Behavioral Sciences (MindTap C...
Statistics
ISBN:9781305504912
Author:Frederick J Gravetter, Larry B. Wallnau
Publisher:Cengage Learning
Elementary Statistics: Picturing the World (7th E...
Statistics
ISBN:9780134683416
Author:Ron Larson, Betsy Farber
Publisher:PEARSON
The Basic Practice of Statistics
Statistics
ISBN:9781319042578
Author:David S. Moore, William I. Notz, Michael A. Fligner
Publisher:W. H. Freeman
Introduction to the Practice of Statistics
Statistics
ISBN:9781319013387
Author:David S. Moore, George P. McCabe, Bruce A. Craig
Publisher:W. H. Freeman