
MATLAB: An Introduction with Applications
6th Edition
ISBN: 9781119256830
Author: Amos Gilat
Publisher: John Wiley & Sons Inc
expand_more
expand_more
format_list_bulleted
Related questions
Question
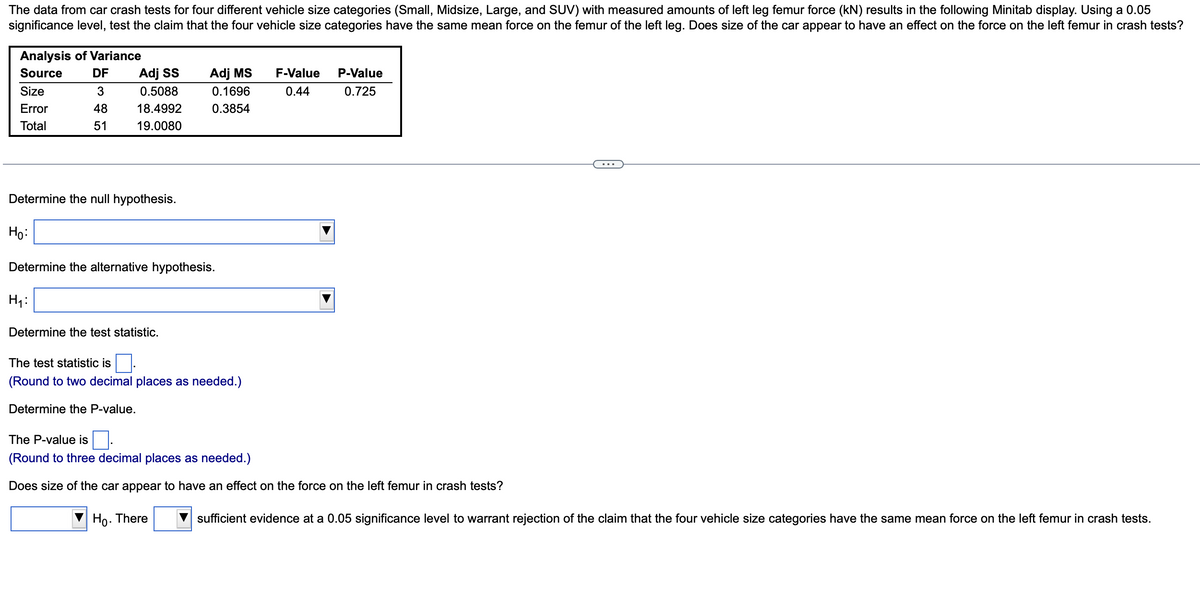

Transcribed Image Text:The data from car crash tests for four different vehicle size categories (Small, Midsize, Large, and SUV) with measured amounts of left leg femur force (kN) results in the following Minitab display. Using a 0.05
significance level, test the claim that the four vehicle size categories have the same mean force on the femur of the left leg. Does size of the car appear to have an effect on the force on the left femur in crash tests?
Analysis of Variance
Source
Size
Error
Total
Determine the null hypothesis.
Ho:
DF Adj SS
0.5088
18.4992
3
48
51
19.0080
H₁:
Determine the alternative hypothesis.
Adj MS
0.1696
0.3854
Determine the test statistic.
The test statistic is
(Round to two decimal places as needed.)
Determine the P-value.
F-Value
0.44
P-Value
0.725
The P-value is.
(Round to three decimal places as needed.)
Does size of the car appear to have an effect on the force on the left femur in crash tests?
Ho. There
sufficient evidence at a 0.05 significance level to warrant rejection of the claim that the four vehicle size categories have the same mean force on the left femur in crash tests.
Expert Solution
This question has been solved!
Explore an expertly crafted, step-by-step solution for a thorough understanding of key concepts.

This is a popular solution

Trending nowThis is a popular solution!

Step by stepSolved in 2 steps

Knowledge Booster

Similar questions
- he data on the number of chocolate chips per bag for 42 bags of Chips Ahoy! cookies were obtained by the students in an introductory statistics class at the United States Air Force Academy in response to the Chips Ahoy! 1,000 Chips Challenge sponsored by Nabisco, the makers of Chips Ahoy! Use the data collected by the students to answer the following questions and to conduct the analyses required in each part. They found ¯xx¯ = 1261.6 and s = 117.6 a. Determine a 95% confidence interval for the mean number of chips per bag for all bags of Chips Ahoy! cookies. ≤μ≤≤μ≤ b. Interpret your result in words. c. Can you conclude that the average bag of Chips Ahoy! Cookies contain at least 1000 chocolate chips? yes noarrow_forwardA case-control (or retrospective) study was conducted to investigate a relationship between the colors of helmets worn by motorcycle drivers and whether they are injured or killed in a crash. Results are given in the accompanying table. Using a 0.05 significance level, test the claim that injuries are independent of helmet color. Color of Helmet Black White Yellow Red Blue Controls (not injured) 472 352 30 163 70 Cases (injured or killed) 201 106 8 67 34 Click here to view the chi-square distribution table. LOADING... Identify the null and alternative hypotheses. Choose the correct answer below. A. Upper H 0 : Whether a crash occurs and helmet color are independent Upper H 1 : Whether a crash occurs and helmet color are dependent B. Upper H 0 : Whether a crash occurs and helmet color are dependent Upper H 1 :…arrow_forwardTo determine if there is gender and/or race discrimination in car buying, a researcher put together a team of white males, black males, white females, and black females who were each asked to obtain an initial offer price from the dealer on a certain model car. The accompanying data are based on the results and represent the profit on the initial price offered by the dealer. Previous testing resulted in rejecting Ho: PWM HBM =HWF = HBF and concluding that the mean profit for the four race-gender groups differ. Use Tukey's test to determine which pairwise means differ using a familywise error rate of a = 0.05. Click the icon to view the data table. Use Tukey's test to determine which pairwise means differ using a familywise error rate of a = 0.05. Find the Tukey 95% simultaneous confidence intervals for all pairwise comparisons. The interval for the pairwise comparision HBM HWM is The interval for the pairwise comparision pwFPWM is The interval for the pairwise comparision HBF HWM is…arrow_forward
- a study of store checkout scanners, 1234 items were checked and 23 checked items were overcharges. Use a 0.05 significance level to test the claim that with scanners, 1% of sales are overchanrges. (Before scanners were used, the overcharge rate was estimated to be about 1%). a. Define the parameter A. mu = The proportion of all sales that are undercharges B. p = The proportion of all sales that are incorrect C. p = The proportion of all sales that are overcharges D. mu = The mean number of sales that are overcharges b. State the null and alternative hypotheses A. Upper H 0 : mu not equals 0.01 Upper H 1 : mu equals 0.01 B. Upper H 0 : p greater than 0.01 Upper H 1 : p equals 0.01 C. Upper H 0 : p equals 0.01 Upper H 1 : p not equals 0.01 D. Upper H 0 : p equals 23 Upper H 1 : p less than 23 c. Calculate the sample proportion ModifyingAbove p…arrow_forwardSuppose the National Transportation Safety Board wants to examine the safety of compact cars, midsize cars, and full-size cars. It collects a sample of three for each of the treatments (cars types). Test the claim that the mean pressure applied to the driver's head during a crash is equal for all three types of cars. Use a = 0.05 Compact Cars 643 Midsize Cars 469 Full-size Cars 484 655 m 427 456 20 Apple 702 525 A 402 Show your 6 steps labeled in order in the box below using the p-value method.arrow_forwardOnly need the last question. Please put anwsers in bold thank you! A researcher with the Department of Education followed a cohort of students who graduated from high school in a certain year, monitoring the progress the students made toward completing a bachelor's degree. One aspect of his research was to determine whether students who first attended community college took longer to attain abachelor's degree than those who immediately attended and remained at a 4-year institution.arrow_forward
arrow_back_ios
arrow_forward_ios
Recommended textbooks for you
- MATLAB: An Introduction with ApplicationsStatisticsISBN:9781119256830Author:Amos GilatPublisher:John Wiley & Sons Inc
 Probability and Statistics for Engineering and th...StatisticsISBN:9781305251809Author:Jay L. DevorePublisher:Cengage Learning
 Statistics for The Behavioral Sciences (MindTap C...StatisticsISBN:9781305504912Author:Frederick J Gravetter, Larry B. WallnauPublisher:Cengage Learning
  Elementary Statistics: Picturing the World (7th E...StatisticsISBN:9780134683416Author:Ron Larson, Betsy FarberPublisher:PEARSON
 The Basic Practice of StatisticsStatisticsISBN:9781319042578Author:David S. Moore, William I. Notz, Michael A. FlignerPublisher:W. H. Freeman
 Introduction to the Practice of StatisticsStatisticsISBN:9781319013387Author:David S. Moore, George P. McCabe, Bruce A. CraigPublisher:W. H. Freeman
MATLAB: An Introduction with Applications
Statistics
ISBN:9781119256830
Author:Amos Gilat
Publisher:John Wiley & Sons Inc
Probability and Statistics for Engineering and th...
Statistics
ISBN:9781305251809
Author:Jay L. Devore
Publisher:Cengage Learning
Statistics for The Behavioral Sciences (MindTap C...
Statistics
ISBN:9781305504912
Author:Frederick J Gravetter, Larry B. Wallnau
Publisher:Cengage Learning
Elementary Statistics: Picturing the World (7th E...
Statistics
ISBN:9780134683416
Author:Ron Larson, Betsy Farber
Publisher:PEARSON
The Basic Practice of Statistics
Statistics
ISBN:9781319042578
Author:David S. Moore, William I. Notz, Michael A. Fligner
Publisher:W. H. Freeman
Introduction to the Practice of Statistics
Statistics
ISBN:9781319013387
Author:David S. Moore, George P. McCabe, Bruce A. Craig
Publisher:W. H. Freeman