The CSV file modeldata.csv contains 200 observations of 4 explanatory variables (x1, x2, x3, x4) and a response variable (y). A multiple linear regression model is built in R using the following code, > modeldata <- read.csv("modeldata.csv") > x1 <- modeldata$x1 > x2 <- modeldata$x2 > x3 <- modeldata$x3 > x4 <- modeldata$x4 > y <- modeldata$y > model <- lm(y~x1+x2+x3+x4) Question: What this particular plot shows about the model being analysed?
The CSV file modeldata.csv contains 200 observations of 4 explanatory variables (x1, x2, x3, x4) and a response variable (y). A multiple linear regression model is built in R using the following code, > modeldata <- read.csv("modeldata.csv") > x1 <- modeldata$x1 > x2 <- modeldata$x2 > x3 <- modeldata$x3 > x4 <- modeldata$x4 > y <- modeldata$y > model <- lm(y~x1+x2+x3+x4) Question: What this particular plot shows about the model being analysed?

Glencoe Algebra 1, Student Edition, 9780079039897, 0079039898, 2018
18th Edition
ISBN:9780079039897
Author:Carter
Publisher:Carter
Chapter10: Statistics
Section10.3: Measures Of Spread
Problem 18HP

Related questions
Question
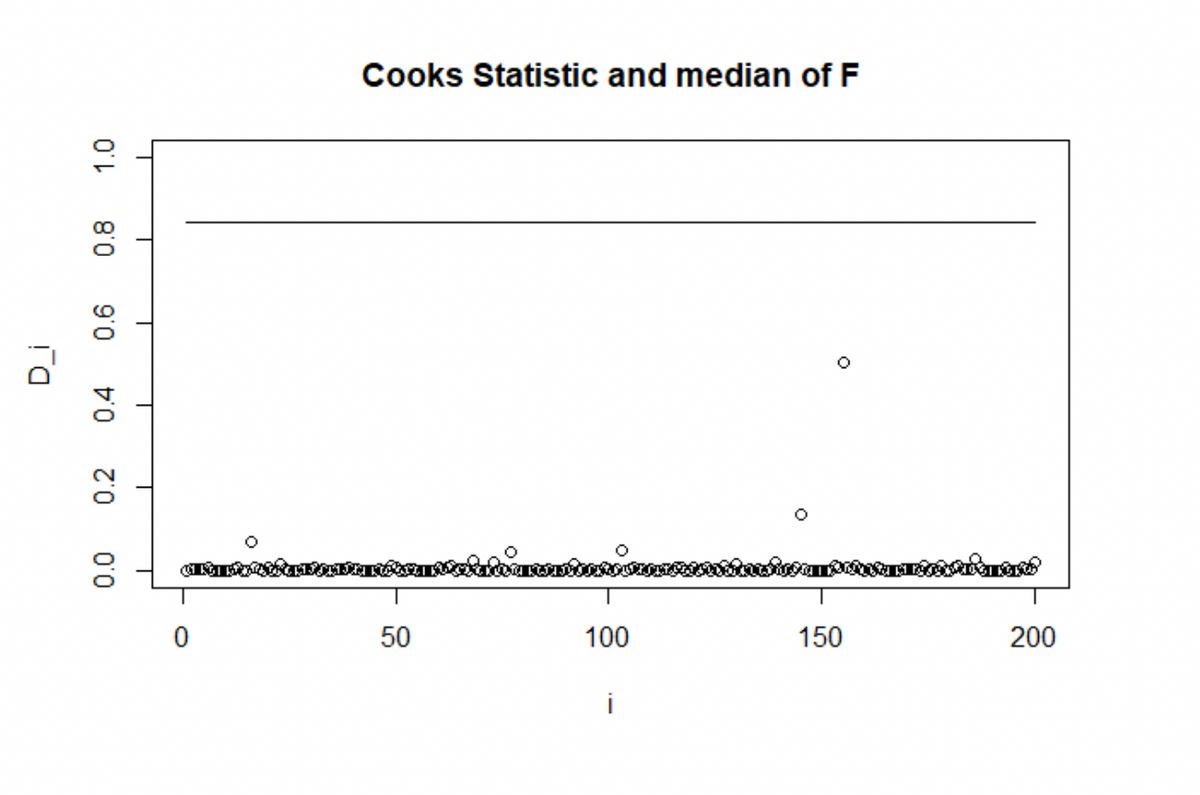
The CSV file modeldata.csv contains 200 observations of 4 explanatory variables (x1, x2, x3, x4) and a response variable (y). A multiple linear regression model is built in R using the following code,
> modeldata <- read.csv("modeldata.csv") > x1 <- modeldata$x1 > x2 <- modeldata$x2 > x3 <- modeldata$x3 > x4 <- modeldata$x4 > y <- modeldata$y > model <- lm(y~x1+x2+x3+x4)Question: What this particular plot shows about the model being analysed?
Transcribed Image Text:Di
0.0
0.2
0.4
0.8
0.6
1.0
0
Cooks Statistic and median of F
50
50
100
150
о
200
Expert Solution
This question has been solved!
Explore an expertly crafted, step-by-step solution for a thorough understanding of key concepts.

Step by step
Solved in 3 steps with 1 images

Recommended textbooks for you
Glencoe Algebra 1, Student Edition, 9780079039897…
Algebra
ISBN:
9780079039897
Author:
Carter
Publisher:
McGraw Hill

Glencoe Algebra 1, Student Edition, 9780079039897…
Algebra
ISBN:
9780079039897
Author:
Carter
Publisher:
McGraw Hill