
MATLAB: An Introduction with Applications
6th Edition
ISBN: 9781119256830
Author: Amos Gilat
Publisher: John Wiley & Sons Inc
expand_more
expand_more
format_list_bulleted
Related questions
Question
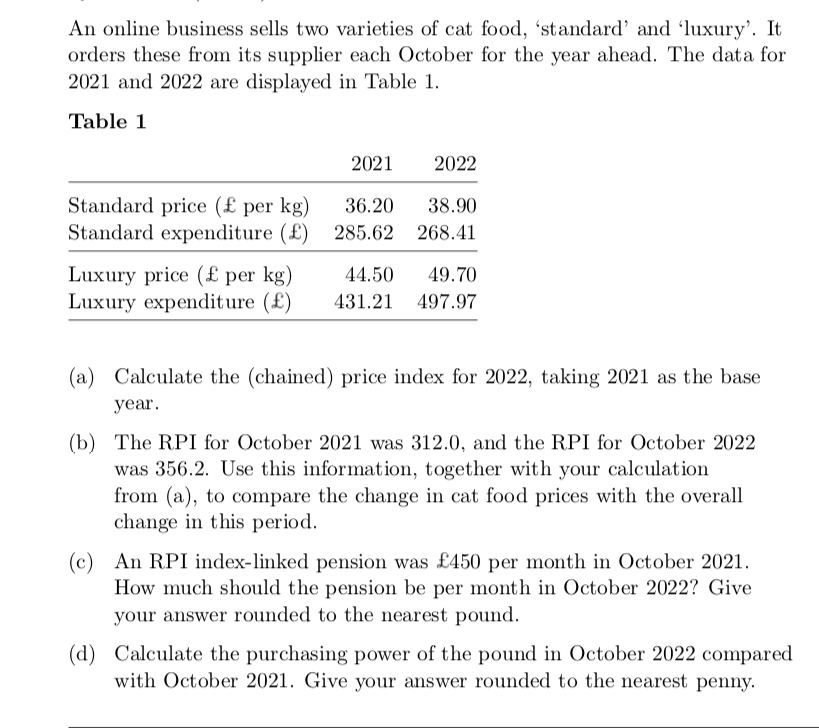

Transcribed Image Text:An online business sells two varieties of cat food, 'standard' and 'luxury'. It
orders these from its supplier each October for the year ahead. The data for
2021 and 2022 are displayed in Table 1.
Table 1
2021
2022
Standard price (£ per kg)
36.20 38.90
Standard expenditure (£) 285.62 268.41
Luxury price (£ per kg)
Luxury expenditure (£)
44.50 49.70
431.21 497.97
(a) Calculate the (chained) price index for 2022, taking 2021 as the base
year.
(b) The RPI for October 2021 was 312.0, and the RPI for October 2022
was 356.2. Use this information, together with your calculation
from (a), to compare the change in cat food prices with the overall
change in this period.
(c) An RPI index-linked pension was £450 per month in October 2021.
How much should the pension be per month in October 2022? Give
your answer rounded to the nearest pound.
(d) Calculate the purchasing power of the pound in October 2022 compared
with October 2021. Give your answer rounded to the nearest penny.
Expert Solution
This question has been solved!
Explore an expertly crafted, step-by-step solution for a thorough understanding of key concepts.

Step by stepSolved in 1 steps

Knowledge Booster

Similar questions
- This data type data is non-numbers, OR numbers that do not represent quantities.arrow_forwardAnswer this question in R. Show as much of your work as possible.arrow_forwardCreate a scatterplot using this data: Long-Term Assets Long-Term Debt 26 16 39 20 45 24 47 26 47 30 48 36 54 38 56 43 60 46 62 42 64 38 69 48 Evaluate the scatterplot and choose the best descriptor of the evaluation. no relationship insufficient information positive negativearrow_forward
- Mode can be more than one in a data set but medium cannot be.explainarrow_forwardUse this dataset for your analysis software.Cost-to-charge ratio (the percentage of the amount billed that represents the actual cost) for inpatient and outpatient services at 11 Oregon hospitals is shown in the following table. A scatterplot of the data is also shown. Cost-to-Charge Ratio Hospital OutpatientCare InpatientCare 1 62 80 2 66 76 3 63 75 4 51 62 5 75 100 6 65 88 7 56 64 8 45 50 9 48 54 10 71 83 11 54 100 The least-squares regression line with y = inpatient cost-to-charge ratio and x = outpatient cost-to-charge ratio is = -1.1 + 1.29 x. (a) Is the observation for Hospital 11 an influential observation? Yes or No (b) Is the observation for Hospital 11 an outlier? Yes or No (c) Is the observation for Hospital 5 an influential observation? Yes or No (d) Is the observation for Hospital 5 an outlier? Yes or Noarrow_forwardDefine the term Qualitative variable with example?arrow_forward
- Which is the line of best fit for the data shown in the table? y 2 4 6. 6. 8. 8. 9. 9. O y = 0.72x+3.04 O y = 2.68x + 0.75 O y = 0.75x+ 2.68 O y = 2.68x + 0.70 96 XHN456arrow_forwardThe decrease in cholesterol level (in mg/dL) for ten individuals are listed below. Calculate the range of the data. 16 22 17 18 22 19 21 20 18 23arrow_forwardDetermine the type of variation model that best fits the data in the attached image.arrow_forward
- Copy and paste an image of your table with data for Patients 1 and 2 in the space provided below. This image should include the calculated values for Mean and Std Dev. Compare the values for Mean and Std Dev for the two patients. Did both patients meet the requirements for an average of 1800.0 Calories per day? Explain in your own words your interpretation of the Std Dev values for the two sets of patient data.arrow_forwardQuestion and data are attached as images. Thank you and will give thumbs up! Data is typed below as well. Non_Stop_Flights one_Stop_flights 1434.9 1556.2 1653.18 1549.33 1617.95 1511.14 1668.19 1497.84 1809.16 1882.04 1641.15 1600.5 1494.61 1699.01 1776.6 1582.12 1894.51 1502.09arrow_forwardProvide a reason why the classification of data is important.arrow_forward
arrow_back_ios
SEE MORE QUESTIONS
arrow_forward_ios
Recommended textbooks for you
- MATLAB: An Introduction with ApplicationsStatisticsISBN:9781119256830Author:Amos GilatPublisher:John Wiley & Sons Inc
 Probability and Statistics for Engineering and th...StatisticsISBN:9781305251809Author:Jay L. DevorePublisher:Cengage Learning
 Statistics for The Behavioral Sciences (MindTap C...StatisticsISBN:9781305504912Author:Frederick J Gravetter, Larry B. WallnauPublisher:Cengage Learning
  Elementary Statistics: Picturing the World (7th E...StatisticsISBN:9780134683416Author:Ron Larson, Betsy FarberPublisher:PEARSON
 The Basic Practice of StatisticsStatisticsISBN:9781319042578Author:David S. Moore, William I. Notz, Michael A. FlignerPublisher:W. H. Freeman
 Introduction to the Practice of StatisticsStatisticsISBN:9781319013387Author:David S. Moore, George P. McCabe, Bruce A. CraigPublisher:W. H. Freeman
MATLAB: An Introduction with Applications
Statistics
ISBN:9781119256830
Author:Amos Gilat
Publisher:John Wiley & Sons Inc
Probability and Statistics for Engineering and th...
Statistics
ISBN:9781305251809
Author:Jay L. Devore
Publisher:Cengage Learning
Statistics for The Behavioral Sciences (MindTap C...
Statistics
ISBN:9781305504912
Author:Frederick J Gravetter, Larry B. Wallnau
Publisher:Cengage Learning
Elementary Statistics: Picturing the World (7th E...
Statistics
ISBN:9780134683416
Author:Ron Larson, Betsy Farber
Publisher:PEARSON
The Basic Practice of Statistics
Statistics
ISBN:9781319042578
Author:David S. Moore, William I. Notz, Michael A. Fligner
Publisher:W. H. Freeman
Introduction to the Practice of Statistics
Statistics
ISBN:9781319013387
Author:David S. Moore, George P. McCabe, Bruce A. Craig
Publisher:W. H. Freeman