
MATLAB: An Introduction with Applications
6th Edition
ISBN: 9781119256830
Author: Amos Gilat
Publisher: John Wiley & Sons Inc
expand_more
expand_more
format_list_bulleted
Related questions
Topic Video
Question
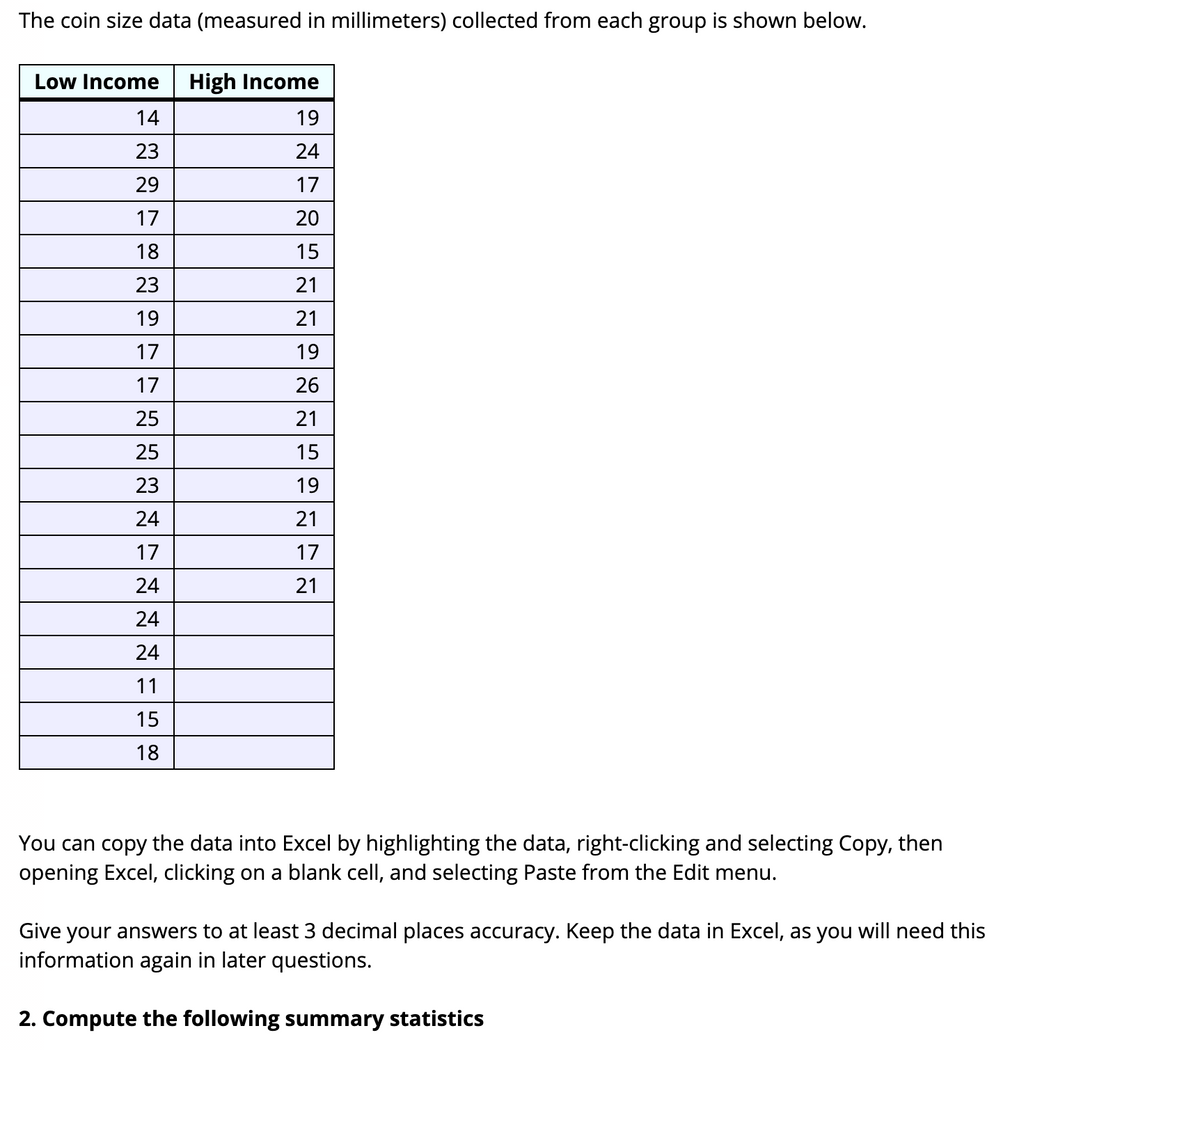

Transcribed Image Text:The coin size data (measured in millimeters) collected from each group is shown below.
Low Income
High Income
14
19
23
24
29
17
17
20
18
15
23
21
19
21
17
19
17
26
25
21
25
15
23
19
24
21
17
17
24
21
24
24
11
15
18
You can copy the data into Excel by highlighting the data, right-clicking and selecting Copy, then
opening Excel, clicking on a blank cell, and selecting Paste from the Edit menu.
Give your answers to at least 3 decimal places accuracy. Keep the data in Excel, as you will need this
information again in later questions.
2. Compute the following summary statistics

Transcribed Image Text:15
18
You can copy the data into Excel by highlighting the data, right-clicking and selecting Copy, then
opening Excel, clicking on a blank cell, and selecting Paste from the Edit menu.
Give your answers to at least 3 decimal places accuracy. Keep the data in Excel, as you will need this
information again in later questions.
2. Compute the following summary statistics
a) The mean for the low income group is:
b) The median for the low income group is:
c) The standard deviation for the low income group is:
d) The mean for the high income group is:
e) The median for the high income group is:
f) The standard deviation for the high income group is:
Expert Solution
This question has been solved!
Explore an expertly crafted, step-by-step solution for a thorough understanding of key concepts.

This is a popular solution

Trending nowThis is a popular solution!

Step by stepSolved in 2 steps with 2 images

Knowledge Booster


Learn more about
Need a deep-dive on the concept behind this application? Look no further. Learn more about this topic, statistics and related others by exploring similar questions and additional content below.Similar questions
- Dr. A. Ventura is interested in determining what kinds and how many pets people own in Bakersfield. He stands outside Petco and asks people what kind of pet they own. This is the result of his survey: dog=1; cat=2; bird=3; reptile=4; fish=5; other=6 1,1,2,2,2,1,1,3,2,3,1,1,1,2,2,4,4,2,2,1,1,1,5,4,3,4,1,1,1,2,2,6,1,1,2,2,1,2,1,2,6,3,4,5arrow_forwardHow long does it take to finish the 1161-mile Iditarod Dog Sled Race from Anchorage to Nome, Alaska? Finish times (to the nearest hour) for 57 dogsled teams are shown below. 261 271 236 244 279 296 284 299 288 288 247 256 338 360 341 333 261 266 287 296 313 311 307 307 299 303 277 283 304 305 288 290 288 289 297 299 332 330 309 328 307 328 285 291 295 298 306 315 310 318 318 320 333 321 323 324 327 USE SALT For this problem, use five classes. (a) Find the class width. 25 236 261 286 311 336 (b) Make a frequency table showing class limits, class boundaries, midpoints, frequencies, relative frequencies, and cumulative frequencies. (Round your relative frequencies to two decimal places.) Class Limits Class Boundaries Midpoint Frequency I I I - 260 285 310 335 360 - Relative Cumulative Frequency Frequencyarrow_forwardThe following table shows the square footage of houses in an area that sold recently along with the selling price. Sq. Ft. Price 2096, 295000, 3160, 338000, 2320, 265000, 3150, 365000, 2760, 330000, 3650, 412000, 2125, 320000, 3085, 342000, 4750, 485000, 2100, 320000, 3100, 316000, 2240, 321000, 3300, 347000, 2800, 350000, 2825, 330000, 3275, 420000 1. Find the equation of the regression line (line of best fit). 2. Determine if there is a strong linear correlation. 3. If there is a strong linear correlation predict the selling price of a 3333 sq. ft. homearrow_forward
- A survey was given to a group of ACC students. Which of the following variables are numerical? Check all that apply. height number of years in district major hours of sleep each week use tobacco or not owns a tabletarrow_forwardThe annual incomes of five people are presented in the table below. When measuring the income distribution in quintiles, which income amount would be considered part of the fourth quintile? Please type the income exactly as presented in the table. Weston $10, 000 Violet $30, 000 Luke $15, 000 Alex $50, 000 Madison $25, 000 Provide your answer below:arrow_forwardAre there any outliers?arrow_forward
- How long does it take to finish the 1161-mile Iditarod Dog Sled Race from Anchorage to Nome, Alaska? Finish times (to the nearest hour) for 57 dogsled teams are shown below. 261 271 236 244 279 296 284 299 288 288 247 256 338 360 341 333 261 266 287 296 313 311 307 307 299 303 277 283 304 305 288 290 288 289 297 299 332 330 309 328 307 328 285 291 295 298 306 315 310 318 318 320 333 321 323 324 327 For this problem, use five classes. (a) Find the class width. (b) Make a frequency table showing class limits, class boundaries, midpoints, frequencies, relative frequencies, and cumulative frequencies. (Give relative frequencies to 2 decimal places.)arrow_forwardThe Nenana Ice Classic is an annual contest to guess the exact time in the spring thaw when a tripod erected on the frozen. Tanana River near Nenana, Alaska, will fall through the ice. The contest has been run since 1917. The 2017 jackpot was $267,444. The table gives simplified data that record only the date on which the tripod fell each year. The earliest date so far is April 20. To make the data casier to use, the table gives the date each year in days starting with April 20. That is, April 20 is 1, April 21 is 2, and so on. Days from April 20 for the Tanana River tripod to fall Duy Year 1917 1918 1919 1920 1921 1922 1923 1924 1925 1926 1927 1928 1929 1930 1931 1932 1933 Year 1948 1969 1970 1971 1972 1973 1974 1975 1976 1977 1978 1979 1980 1981 1982 Days from April 20 for the Tanana River tripod to fall 1983 11 1984 22 14 22 22 23 20 22 16 7 23 17 16 19 21 12 19 Day 19 9 15 19 21 15 17 21 17 11. 11 10 11 21 10 20 Days from April 20 for the Tanana River tripod to fall Year 1934 1935…arrow_forwardAn effect size of .55 would be considered?arrow_forward
arrow_back_ios
arrow_forward_ios
Recommended textbooks for you
- MATLAB: An Introduction with ApplicationsStatisticsISBN:9781119256830Author:Amos GilatPublisher:John Wiley & Sons Inc
 Probability and Statistics for Engineering and th...StatisticsISBN:9781305251809Author:Jay L. DevorePublisher:Cengage Learning
 Statistics for The Behavioral Sciences (MindTap C...StatisticsISBN:9781305504912Author:Frederick J Gravetter, Larry B. WallnauPublisher:Cengage Learning
  Elementary Statistics: Picturing the World (7th E...StatisticsISBN:9780134683416Author:Ron Larson, Betsy FarberPublisher:PEARSON
 The Basic Practice of StatisticsStatisticsISBN:9781319042578Author:David S. Moore, William I. Notz, Michael A. FlignerPublisher:W. H. Freeman
 Introduction to the Practice of StatisticsStatisticsISBN:9781319013387Author:David S. Moore, George P. McCabe, Bruce A. CraigPublisher:W. H. Freeman
MATLAB: An Introduction with Applications
Statistics
ISBN:9781119256830
Author:Amos Gilat
Publisher:John Wiley & Sons Inc
Probability and Statistics for Engineering and th...
Statistics
ISBN:9781305251809
Author:Jay L. Devore
Publisher:Cengage Learning
Statistics for The Behavioral Sciences (MindTap C...
Statistics
ISBN:9781305504912
Author:Frederick J Gravetter, Larry B. Wallnau
Publisher:Cengage Learning
Elementary Statistics: Picturing the World (7th E...
Statistics
ISBN:9780134683416
Author:Ron Larson, Betsy Farber
Publisher:PEARSON
The Basic Practice of Statistics
Statistics
ISBN:9781319042578
Author:David S. Moore, William I. Notz, Michael A. Fligner
Publisher:W. H. Freeman
Introduction to the Practice of Statistics
Statistics
ISBN:9781319013387
Author:David S. Moore, George P. McCabe, Bruce A. Craig
Publisher:W. H. Freeman