MATLAB: An Introduction with Applications
6th Edition
ISBN: 9781119256830
Author: Amos Gilat
Publisher: John Wiley & Sons Inc
expand_more
expand_more
format_list_bulleted
Concept explainers
Topic Video
Question

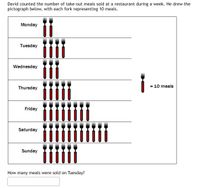
Transcribed Image Text:David counted the number of take-out meals sold at a restaurant during a week. He drew the
pictograph below, with each fork representing 10 meals.
Monday
Tuesday
Wednesday
= 10 meals
Thursday
Friday
Saturday
Sunday
How many meals were sold on Tuesday?
Expert Solution
This question has been solved!
Explore an expertly crafted, step-by-step solution for a thorough understanding of key concepts.
This is a popular solution
Trending nowThis is a popular solution!
Step by stepSolved in 2 steps

Knowledge Booster
Learn more about
Need a deep-dive on the concept behind this application? Look no further. Learn more about this topic, statistics and related others by exploring similar questions and additional content below.Similar questions
- Part 1,2,3 & 4 please!arrow_forwardXavier sketches several designs for a math club pin. The math club voted for the pin shape to be a right triangle. Which of the following triangles could NOT be the shape used for the math club pin? Account Dashboard Courses 13 17 A 5 C 8 Groups 12 15 Calendar 15 в 9 26 D 6 History 12 24 Help OB OD O A -> # %24 1. & * 3 4. 6 backsp e yarrow_forwardHow many values are in the range? 0 to 30arrow_forward
- PART 1-MAP READING The following drawing represents one square mile or 640 acres. The name inside each box is the owner of that land tract. For example, Sandy Smith owns one fourth of a square mile or 160 acres. Refer to the drawing for questions 1-10. For questions with multiple-choice answers, select the correct answer. For questions 1-4, acreage answers must be divisible by 40 (i.e. 80, 120, 160, etc.). How many acres are owned by Stacy Jones? 120 Gail Johnson? Show Transcribed Text 80 80 Dale Dawson?" Terry Jenson?" 80 240 Sandy Stacy Smith Jones (160 acres) Jenson Gail Lou Johnson Lowry Dale Dawson If Johnson, Lowry, and Dawson merged their land, what would be their combined acreage?" Terry Jenson If Johnson sells all his land to Dawson and Lowry sells all his land to Jenson, which landowner within the square mile would own the most land? If Jones sells half his land to Johnson and half to Dawson, which landowner within the square mile wouldarrow_forwardMatch these values of r with the accompanying scatterplots: – 1, - 0.406, - 0.994, 0.406, and 0.764. Click the icon to view the scatterplots. ..... Match the values of r to the scatterplots. Scatterplot 1, r = Scatterplot 2, r= Scatterplot 3, r= Scatterplot 4, r= Scatterplot 5, r =arrow_forwardNo.3arrow_forward
- Use the first table to answer the question? Parts a,b,c and darrow_forwardABCDEFGH is a scale drawing of IJKLMNOP. H B C D FE G K N Marrow_forwardYou will simulate shooting basketball free throws. Using any coin, let heads represent the ball going into the basket and tales represent the ball missing the basket. Each toss of the coin represents a shot at the free throw line. Simulate shooting 35 free throws. Make a chart on your paper similar to the one below to record your results. For each trial (toss), place an x in the appropriate column. Toss number 1 2 Went in (Heads) X Questions: 1. How many free throws went into the basket? 2. How many free throws missed the basket? Missed (Tails) X 3. What is the experimental probability that you will make the next free throw? 4. What is the experimental probability that you will miss the next free throw? 5. This simulation assumes that you have an equal chance of making the free throw or missing the free throw. Is this a correct assumption? Why? 6. How would you change this simulation to better predict a person's abilities at making free throws?arrow_forward
arrow_back_ios
SEE MORE QUESTIONS
arrow_forward_ios
Recommended textbooks for you
 MATLAB: An Introduction with ApplicationsStatisticsISBN:9781119256830Author:Amos GilatPublisher:John Wiley & Sons Inc
 Probability and Statistics for Engineering and th...StatisticsISBN:9781305251809Author:Jay L. DevorePublisher:Cengage Learning
 Statistics for The Behavioral Sciences (MindTap C...StatisticsISBN:9781305504912Author:Frederick J Gravetter, Larry B. WallnauPublisher:Cengage Learning
 Elementary Statistics: Picturing the World (7th E...StatisticsISBN:9780134683416Author:Ron Larson, Betsy FarberPublisher:PEARSON
 The Basic Practice of StatisticsStatisticsISBN:9781319042578Author:David S. Moore, William I. Notz, Michael A. FlignerPublisher:W. H. Freeman
 Introduction to the Practice of StatisticsStatisticsISBN:9781319013387Author:David S. Moore, George P. McCabe, Bruce A. CraigPublisher:W. H. Freeman

MATLAB: An Introduction with Applications
Statistics
ISBN:9781119256830
Author:Amos Gilat
Publisher:John Wiley & Sons Inc

Probability and Statistics for Engineering and th...
Statistics
ISBN:9781305251809
Author:Jay L. Devore
Publisher:Cengage Learning

Statistics for The Behavioral Sciences (MindTap C...
Statistics
ISBN:9781305504912
Author:Frederick J Gravetter, Larry B. Wallnau
Publisher:Cengage Learning

Elementary Statistics: Picturing the World (7th E...
Statistics
ISBN:9780134683416
Author:Ron Larson, Betsy Farber
Publisher:PEARSON

The Basic Practice of Statistics
Statistics
ISBN:9781319042578
Author:David S. Moore, William I. Notz, Michael A. Fligner
Publisher:W. H. Freeman

Introduction to the Practice of Statistics
Statistics
ISBN:9781319013387
Author:David S. Moore, George P. McCabe, Bruce A. Craig
Publisher:W. H. Freeman