
MATLAB: An Introduction with Applications
6th Edition
ISBN: 9781119256830
Author: Amos Gilat
Publisher: John Wiley & Sons Inc
expand_more
expand_more
format_list_bulleted
Related questions
Concept explainers
Topic Video
Question
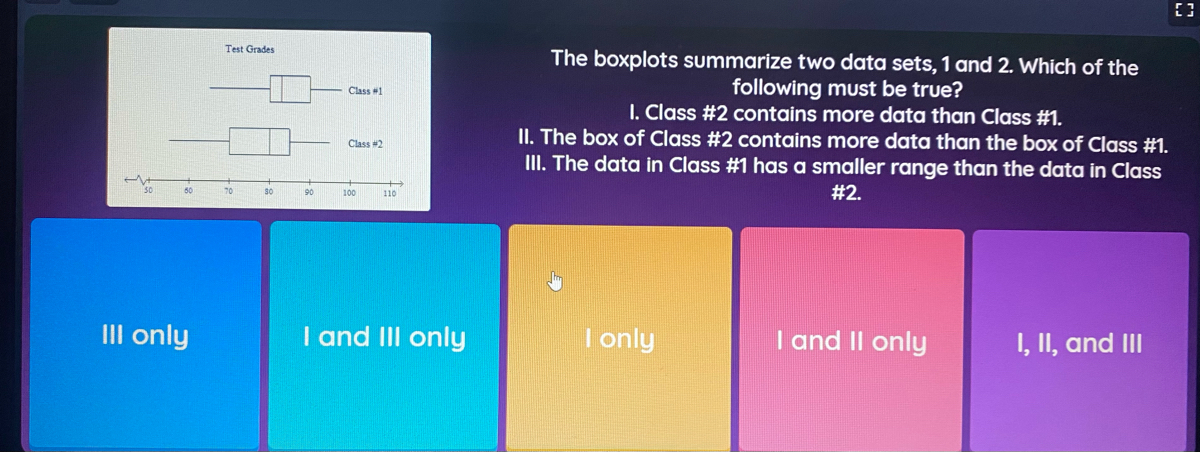

Transcribed Image Text:Test Grades
The boxplots summarize two data sets, 1 and 2. Which of the
following must be true?
I. Class #2 contains more data than Class #1.
II. The box of Class #2 contains more data than the box of Class #1.
II. The data in Class #1 has a smaller range than the data in Class
Class #1
Class #2
#2.
50
70
90
100
110
III only
I and III only
I only
I and II only
I, II, and III

Transcribed Image Text:Test Grades
Class #1
Class #2
30
60
70
80
90
100
110
Expert Solution
This question has been solved!
Explore an expertly crafted, step-by-step solution for a thorough understanding of key concepts.

This is a popular solution

Trending nowThis is a popular solution!

Step by stepSolved in 2 steps

Knowledge Booster


Learn more about
Need a deep-dive on the concept behind this application? Look no further. Learn more about this topic, statistics and related others by exploring similar questions and additional content below.Similar questions
- For an article in a magazine, 20 different vehicles were selected to obtain data for comparison. From each vehicle the price in dollars, the fuel economy (in miles per gallon), the number of doors, the type of vehicle (car, truck, SUV, other), and if it had all wheel drive or not. a. What are the cases? b. List the variables and identify them as quantitative or categorical.arrow_forwardDraw a scatter diagram for a set of data that has an r= -1arrow_forwardOnly answer parts a, b, and c for now.arrow_forward
- Choose the best one a or b or c or darrow_forwardResidents in a city are charged for water usage every three months. The water bill is computed from a common fee, along with the amount of water the customers use. The last water bills for 40 neighborhood residents are displayed in the histogram below. Which of these correctly describes the shape of the distribution of water bills? uniform skewed left skewed right Neighborhood Monthly Water Bill O roughly symmetric 15 43 100 125 150 175 200 225 250 Frequencyarrow_forwardFind the mode of the data set: 13, 32, 25, 27, 13 O 22 O 13 O 24.5 O 25 Eo search F3 F4 F5 F6 F7 F8 F9 2$ % &arrow_forward
- D, E and F please, thank you!arrow_forwardIn this problem, we explore the effect on the mean, median, and mode of adding the same number to each data value. Consider the data set 2, 2, 3, 6, 10. (a) Compute the mode, median, and mean. (Enter your answers to one decimal place.)mode median mean (b) Add 7 to each of the data values. Compute the mode, median, and mean. (Enter your answers to one decimal place.)mode median mean (c) Compare the results of parts (a) and (b). In general, how do you think the mode, median, and mean are affected when the same constant is added to each data value in a set? -Adding the same constant c to each data value results in the mode, median, and mean decreasing by c units. -Adding the same constant c to each data value results in the mode, median, and mean remaining the same. -Adding the same constant c to each data value results in the mode, median, and mean increasing by c units. -There is no distinct pattern when the same constant is added to each data value in a set.arrow_forwardWhat type of data (categorical, discrete numerical, continuous numerical) is each of the following variables? If there is any ambiguity about the data type, explain why the answer is unclear. Your college program. The number of college credits you have earned. Length of a TV commercial. The country with the most 2021 Olympic medalsarrow_forward
- The prices of 12 different types of cereal, rounded to the nearest dollar, are shown. Make a dot of the data. 4|5|6|4|5|5 5|8|4|3|4|4arrow_forwardIn statistics, the data we work with is just one part of a bigger picture called the ____. In statistics, the data we work with is just one part of a bigger picture called thearrow_forwardFor the data set 8 14 6 10 9 the median isarrow_forward
arrow_back_ios
SEE MORE QUESTIONS
arrow_forward_ios
Recommended textbooks for you
- MATLAB: An Introduction with ApplicationsStatisticsISBN:9781119256830Author:Amos GilatPublisher:John Wiley & Sons Inc
 Probability and Statistics for Engineering and th...StatisticsISBN:9781305251809Author:Jay L. DevorePublisher:Cengage Learning
 Statistics for The Behavioral Sciences (MindTap C...StatisticsISBN:9781305504912Author:Frederick J Gravetter, Larry B. WallnauPublisher:Cengage Learning
  Elementary Statistics: Picturing the World (7th E...StatisticsISBN:9780134683416Author:Ron Larson, Betsy FarberPublisher:PEARSON
 The Basic Practice of StatisticsStatisticsISBN:9781319042578Author:David S. Moore, William I. Notz, Michael A. FlignerPublisher:W. H. Freeman
 Introduction to the Practice of StatisticsStatisticsISBN:9781319013387Author:David S. Moore, George P. McCabe, Bruce A. CraigPublisher:W. H. Freeman
MATLAB: An Introduction with Applications
Statistics
ISBN:9781119256830
Author:Amos Gilat
Publisher:John Wiley & Sons Inc
Probability and Statistics for Engineering and th...
Statistics
ISBN:9781305251809
Author:Jay L. Devore
Publisher:Cengage Learning
Statistics for The Behavioral Sciences (MindTap C...
Statistics
ISBN:9781305504912
Author:Frederick J Gravetter, Larry B. Wallnau
Publisher:Cengage Learning
Elementary Statistics: Picturing the World (7th E...
Statistics
ISBN:9780134683416
Author:Ron Larson, Betsy Farber
Publisher:PEARSON
The Basic Practice of Statistics
Statistics
ISBN:9781319042578
Author:David S. Moore, William I. Notz, Michael A. Fligner
Publisher:W. H. Freeman
Introduction to the Practice of Statistics
Statistics
ISBN:9781319013387
Author:David S. Moore, George P. McCabe, Bruce A. Craig
Publisher:W. H. Freeman