MATLAB: An Introduction with Applications
6th Edition
ISBN: 9781119256830
Author: Amos Gilat
Publisher: John Wiley & Sons Inc
expand_more
expand_more
format_list_bulleted
Question

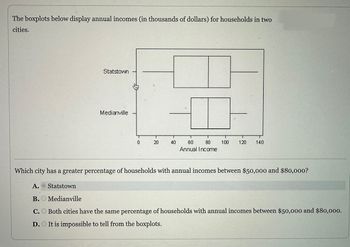
Transcribed Image Text:The boxplots below display annual incomes (in thousands of dollars) for households in two
cities.
Statstown
Medianville
€
0
20
40
T
T
60 80
Annual Income
T
100 120 140
Which city has a greater percentage of households with annual incomes between $50,000 and $80,000?
A. Statstown
B. Medianville
C. Both cities have the same percentage of households with annual incomes between $50,000 and $80,000.
D. It is impossible to tell from the boxplots.
Expert Solution
This question has been solved!
Explore an expertly crafted, step-by-step solution for a thorough understanding of key concepts.
This is a popular solution
Trending nowThis is a popular solution!
Step by stepSolved in 2 steps

Knowledge Booster
Similar questions
- Answer this question in R. Show as much of your work as possible.arrow_forwardThe above figure shows variations and means of data sets A and B visually. Which of the following statement is TRUE about this figure? answer choices 1.Means of data sets A and B are different. 2.Variations of both data sets are same. 3.Data set A has higher variation than data set B. 4.Data set B has higher variation than data set A.arrow_forwardThe energy consumption of a group of studio condos is stated below. One set of condos is facing the sun while the other set is not. Determine the interquartile range in each data set and analyze the differences in context. Be sure to show all equations and calculations used. Answer in complete sentences. Facing the sun (kilowatt hours per month): 850, 700, 450, 320, 900, 1500, 456, 742, 753, 854, 1000, 547, 865 Not facing the sun (kilowatt hours per month): 950, 750, 525, 410, 990, 1640, 556, 842, 853, 954, 1150, 647, 965arrow_forward
- Use the following table: $386 $328 $265 $428 $245 446 254 587 326 345 417 326 312 363 385 Prepare a frequency distribution from the above weekly salaries of teachers at Pikes Peak Community College. Use the following intervals: Salaries. Frequency $200 - $299.99. ?? 300 - 399.99. ?? 400 - 499.99. ?? 500 - 599.99. ??arrow_forwardPlease show me how this is worked outarrow_forwardPlease help.arrow_forward
- See pictures and graphic for questions A, B and C Problem Miguel is Human Resources Manager for two hospitals in a metropolitan area. He is comparing data about the amount of sick leave (in days) taken by each of 104 full-time nurses in each of the two hospitals. The histograms below show the distributions of the two data sets. Each histogram shows the number of days of sick leave taken on the horizontal axis and the number of full-time nurses on the vertical axis. The means and standard deviations for the data sets are also given.arrow_forwardA store manager kept track of the number of newspapers sold each week over a seven-week period. The results are shown below. 81 71 202 113 269 248 242 Find the median number of newspapers sold. Question content area bottom Part 1 A. 175 newspapers B. 202 newspapers C. 242 newspapers D. 113 newspapersarrow_forwardKindly solve both partsarrow_forward
- Solve the attached question and give final answers please.The question and historical data is attached.arrow_forwardA high school has 44 players on the football team. The summary of the players' weights is given in the box plot. Approximately, what is the percentage of players weighing greater than or equal to 234 pounds? 166 203 234 154 256 - 0o 150 160 170 180 | 190 200 210 220 230 240 250 260 270 00 Weight (in pounds)arrow_forwardPlease help 11 and 12arrow_forward
arrow_back_ios
SEE MORE QUESTIONS
arrow_forward_ios
Recommended textbooks for you
 MATLAB: An Introduction with ApplicationsStatisticsISBN:9781119256830Author:Amos GilatPublisher:John Wiley & Sons Inc
 Probability and Statistics for Engineering and th...StatisticsISBN:9781305251809Author:Jay L. DevorePublisher:Cengage Learning
 Statistics for The Behavioral Sciences (MindTap C...StatisticsISBN:9781305504912Author:Frederick J Gravetter, Larry B. WallnauPublisher:Cengage Learning
 Elementary Statistics: Picturing the World (7th E...StatisticsISBN:9780134683416Author:Ron Larson, Betsy FarberPublisher:PEARSON
 The Basic Practice of StatisticsStatisticsISBN:9781319042578Author:David S. Moore, William I. Notz, Michael A. FlignerPublisher:W. H. Freeman
 Introduction to the Practice of StatisticsStatisticsISBN:9781319013387Author:David S. Moore, George P. McCabe, Bruce A. CraigPublisher:W. H. Freeman

MATLAB: An Introduction with Applications
Statistics
ISBN:9781119256830
Author:Amos Gilat
Publisher:John Wiley & Sons Inc

Probability and Statistics for Engineering and th...
Statistics
ISBN:9781305251809
Author:Jay L. Devore
Publisher:Cengage Learning

Statistics for The Behavioral Sciences (MindTap C...
Statistics
ISBN:9781305504912
Author:Frederick J Gravetter, Larry B. Wallnau
Publisher:Cengage Learning

Elementary Statistics: Picturing the World (7th E...
Statistics
ISBN:9780134683416
Author:Ron Larson, Betsy Farber
Publisher:PEARSON

The Basic Practice of Statistics
Statistics
ISBN:9781319042578
Author:David S. Moore, William I. Notz, Michael A. Fligner
Publisher:W. H. Freeman

Introduction to the Practice of Statistics
Statistics
ISBN:9781319013387
Author:David S. Moore, George P. McCabe, Bruce A. Craig
Publisher:W. H. Freeman