Algebra and Trigonometry (6th Edition)
6th Edition
ISBN: 9780134463216
Author: Robert F. Blitzer
Publisher: PEARSON
expand_more
expand_more
format_list_bulleted
Question

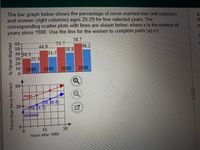
Transcribed Image Text:The bar graph below shows the percentage of never-married men (left columns)
and women (right columns) ages 25-29 for four selected years. The
corresponding scatter plots with lines are shown below, where x is the number of
years since 1980. Use the line for the women to complete parts (a)-(c).
a,
fir
58.7
60-
51.7
46.2
50-
40-30 3
213
44 9
31.7
38.8
1980
1990
2000
2008
60-
men.
20.38.8)
10,31.7)
30-*
women
15
30
Years after 1980
Percentage Never Married
% Never Manied

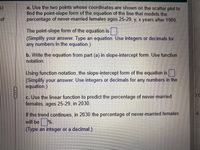
Transcribed Image Text:a. Use the two points whose coordinates are shown on the scatter plot to
find the point-slope form of the equation of the line that models the
percentage of never-married females ages 25-29, y, x years after 1980.
of
The point-slope form of the equation is
(Simplify your answer. Type an equation. Use integers or decimals for
any numbers in the equation.)
b. Write the equation from part (a) in slope-intercept form. Use function
notation.
Using function notation, the slope-intercept form of the equation is
(Simplify your answer. Use integers or decimals for any numbers in the
equation.)
c. Use the linear function to predict the percentage of never-married
females, ages 25-29, in 2030.
If the trend continues, in 2030 the percentage of never-married females
will be %.
(Type an integer or a decimal.)
Expert Solution
This question has been solved!
Explore an expertly crafted, step-by-step solution for a thorough understanding of key concepts.
This is a popular solution
Trending nowThis is a popular solution!
Step by stepSolved in 2 steps with 2 images

Knowledge Booster
Similar questions
- Here are the scores of 16 students on a history test. 61, 63, 70, 72, 75, 75, 76, 79, 79, 81, 82, 84, 84, 89, 91, 95. Notice that the scores are ordered from least to greatest. Make a box-and-whisker plot for the data. +++ 60 65 70 75 85 90 95 Score 80arrow_forwardGiven below is the scatter plot of the market value and profit of 50 U.S. companies. Market Value ($000) Positive relationship Negative relationship What kind of relationship is represented? No relationship Scatter Plot at maak Informat Profits ($000)arrow_forwardUse the box-and-whisker plot to identify the five-number summary. 940 2081 1205 1477 1957 900 1200 1500 1800 2100arrow_forward
- Here is a data set: 24 18 21 32 21 29 29 35 20 39 31 18 20 18 28 22 26 22 34 34 You are examining the data with a split stem-and-leaf plot. Here is the start of the plot: 1 | 888 2 | 0011224 2 | 6899 31 3 | What should be entered in the second to last row of this table? 31 Question Help:Video Message instructorarrow_forwardConstruct a stem-and-leaf plot of the test scores 68, 73, 85, 75, 89, 89, 87, 90, 99, 100. How does the stem-and-leaf plot show the distribution of these data? Construct the stem-and-leaf plot. Choose the correct answer below. O A. B. Stem 6 7 8 9 10 Stem Leaves 6 7 8 8 35 5996 09 9 10 0 Leaves 5 35 5997 07 0 O C. Stem 6 7 8 9 10 Leaves 8 36 5697 09 0 O D. How does the stem-and-leaf plot show the distribution of these data? O A. The lengths of the rows are similar to the widths of bars in a histogram; longer rows of data correspond to smaller frequencies. O B. The lengths of the rows are similar to the heights of bars in a histogram; longer rows of data correspond to higher frequencies. O C. The lengths of the rows are similar to the heights of bars in a histogram; longer rows of data correspond to smaller frequencies. Stem 6 7 8 9 10 Leaves 8 35 5799 09 0arrow_forwardA high school has 32 players on the football team. The summary of the players' weights is given in the box plot. What is the median weight of the players? 193 200 243 188 264 - 0o 150 160 170 180 190 200 210 220 230 240 250 260 270 00 Weight (in pounds) Answer O Tables E Keypad Keyboard Shortcuts poundsarrow_forward
- How do the medians compare between the two dot plotsarrow_forwardA high school has 44 players on the football team. The summary of the players' weights is given in the box plot. Approximately, what is the percentage of players weighing greater than or equal to 234 pounds? 166 203 234 154 256 - 0o 150 160 170 180 | 190 200 210 220 230 240 250 260 270 00 Weight (in pounds)arrow_forwardPlease help me answer in fullarrow_forward
arrow_back_ios
SEE MORE QUESTIONS
arrow_forward_ios
Recommended textbooks for you
 Algebra and Trigonometry (6th Edition)AlgebraISBN:9780134463216Author:Robert F. BlitzerPublisher:PEARSON
 Contemporary Abstract AlgebraAlgebraISBN:9781305657960Author:Joseph GallianPublisher:Cengage Learning
 Linear Algebra: A Modern IntroductionAlgebraISBN:9781285463247Author:David PoolePublisher:Cengage Learning
 Algebra And Trigonometry (11th Edition)AlgebraISBN:9780135163078Author:Michael SullivanPublisher:PEARSON
 Introduction to Linear Algebra, Fifth EditionAlgebraISBN:9780980232776Author:Gilbert StrangPublisher:Wellesley-Cambridge Press
 College Algebra (Collegiate Math)AlgebraISBN:9780077836344Author:Julie Miller, Donna GerkenPublisher:McGraw-Hill Education

Algebra and Trigonometry (6th Edition)
Algebra
ISBN:9780134463216
Author:Robert F. Blitzer
Publisher:PEARSON

Contemporary Abstract Algebra
Algebra
ISBN:9781305657960
Author:Joseph Gallian
Publisher:Cengage Learning

Linear Algebra: A Modern Introduction
Algebra
ISBN:9781285463247
Author:David Poole
Publisher:Cengage Learning

Algebra And Trigonometry (11th Edition)
Algebra
ISBN:9780135163078
Author:Michael Sullivan
Publisher:PEARSON

Introduction to Linear Algebra, Fifth Edition
Algebra
ISBN:9780980232776
Author:Gilbert Strang
Publisher:Wellesley-Cambridge Press

College Algebra (Collegiate Math)
Algebra
ISBN:9780077836344
Author:Julie Miller, Donna Gerken
Publisher:McGraw-Hill Education