MATLAB: An Introduction with Applications
6th Edition
ISBN: 9781119256830
Author: Amos Gilat
Publisher: John Wiley & Sons Inc
expand_more
expand_more
format_list_bulleted
Question

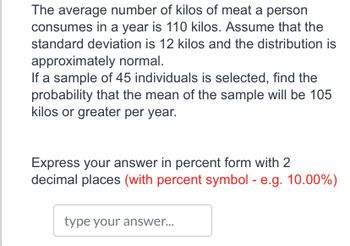
Transcribed Image Text:The average number of kilos of meat a person
consumes in a year is 110 kilos. Assume that the
standard deviation is 12 kilos and the distribution is
approximately normal.
If a sample of 45 individuals is selected, find the
probability that the mean of the sample will be 105
kilos or greater per year.
Express your answer in percent form with 2
decimal places (with percent symbol - e.g. 10.00%)
type your answer...

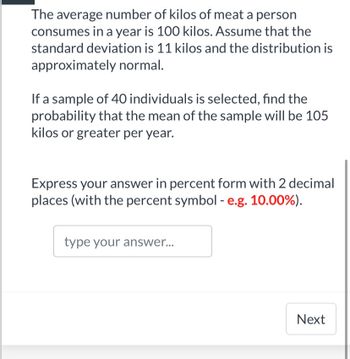
Transcribed Image Text:The average number of kilos of meat a person
consumes in a year is 100 kilos. Assume that the
standard deviation is 11 kilos and the distribution is
approximately normal.
If a sample of 40 individuals is selected, find the
probability that the mean of the sample will be 105
kilos or greater per year.
Express your answer in percent form with 2 decimal
places (with the percent symbol - e.g. 10.00%).
type your answer...
Next
Expert Solution
This question has been solved!
Explore an expertly crafted, step-by-step solution for a thorough understanding of key concepts.
Step by stepSolved in 3 steps with 2 images

Knowledge Booster
Similar questions
- The amount of time a service technician needs to change the oil in a car is uniformly distributed between 11 and 21 minutes. Let X = the time needed to change the oil on a car. c. Find the 50th percentile. Round to the nearest minute.arrow_forwardplease solve: G and H ch 5arrow_forwardTrucks in a delivery fleet travel a mean of 100 miles per day with a standard deviation of 38 miles per day. The mileage per day is distributed normally. Find the probability that a truck drives at least 141 miles in a day. Round your answer to four decimal places.arrow_forward
- One year consumers spent an average of $22 on a meal at a resturant. Assume that the amount spent on a resturant meal is normally distributed and that the standard deviation is $3. Complete parts (a) through (c) below. Between what two values will the middle 95% of the amounts of cash spent fall?arrow_forwardType in your answer below: As in the previous question, female's pulse rates are normally distributed with a mean 74 beats per minute and a standard deviation 12.5 beats per minute. Find the probability that a female has a pulse rate between 60 beats per minute and 70 beats per minute. You can use a calculator or table A-2 in your textbook. Round your answer to three decimal places.arrow_forwardconstruct a 90% condifence interval for the population mean of total calcium in this patient bloodarrow_forward
- Find the standard deviation (rounded to the nearest unit) for the data indicated. Test Score Frequency 90 1 80 4 70 7 60 6 50 3arrow_forwardWhat provides a measure of the variance caused by random, unsystematic differences? a. the error term b. the F ratio c. MS d. SStotalarrow_forwardAssume that a randomly selected subject is given a bone density test. Bone density test scores are normally distributed with a mean of 0 and a standard deviation of 1. Draw a graph and find P7, the 7th percentile. This is the bone density score separating the bottom 7% from the top 93%. Which graph represents P7? Choose the correct graph below. A. P7 The bone density score corresponding to P7 is (Round to two decimal places as needed.) B. A P7 2 C. ^ P7 Ly D. A P7arrow_forward
- The average number of kilos of meat a person consumes in a year is 90 kilos. Assume that the standard deviation is 10 kilos and the distribution is approximately normal. If a sample of 45 individuals is selected, find the probability that the mean of the sample will be 87 kilos or greater per year. Express your answer in percent form with 2 decimal places (with percent symbol - e.g. 10.00%) type your answer...arrow_forwardToday, the waves are crashing onto the beach every 4.3 seconds. The times from when a person arrives at the shoreline until a crashing wave is observed follows a Uniform distribution from 0 to 4.3 seconds. Round to 4 decimal places where possible. 1. 66% of the time a person will wait at least how long before the wave crashes in?arrow_forwardUse the expression in the accompanying discussion of sample size to find the size of each sample if you want to estimate the difference between proportions of men and women who own smartphones. Assume that you want 95% confidence that your error is no more than 0.03.arrow_forward
arrow_back_ios
SEE MORE QUESTIONS
arrow_forward_ios
Recommended textbooks for you
 MATLAB: An Introduction with ApplicationsStatisticsISBN:9781119256830Author:Amos GilatPublisher:John Wiley & Sons Inc
 Probability and Statistics for Engineering and th...StatisticsISBN:9781305251809Author:Jay L. DevorePublisher:Cengage Learning
 Statistics for The Behavioral Sciences (MindTap C...StatisticsISBN:9781305504912Author:Frederick J Gravetter, Larry B. WallnauPublisher:Cengage Learning
 Elementary Statistics: Picturing the World (7th E...StatisticsISBN:9780134683416Author:Ron Larson, Betsy FarberPublisher:PEARSON
 The Basic Practice of StatisticsStatisticsISBN:9781319042578Author:David S. Moore, William I. Notz, Michael A. FlignerPublisher:W. H. Freeman
 Introduction to the Practice of StatisticsStatisticsISBN:9781319013387Author:David S. Moore, George P. McCabe, Bruce A. CraigPublisher:W. H. Freeman

MATLAB: An Introduction with Applications
Statistics
ISBN:9781119256830
Author:Amos Gilat
Publisher:John Wiley & Sons Inc

Probability and Statistics for Engineering and th...
Statistics
ISBN:9781305251809
Author:Jay L. Devore
Publisher:Cengage Learning

Statistics for The Behavioral Sciences (MindTap C...
Statistics
ISBN:9781305504912
Author:Frederick J Gravetter, Larry B. Wallnau
Publisher:Cengage Learning

Elementary Statistics: Picturing the World (7th E...
Statistics
ISBN:9780134683416
Author:Ron Larson, Betsy Farber
Publisher:PEARSON

The Basic Practice of Statistics
Statistics
ISBN:9781319042578
Author:David S. Moore, William I. Notz, Michael A. Fligner
Publisher:W. H. Freeman

Introduction to the Practice of Statistics
Statistics
ISBN:9781319013387
Author:David S. Moore, George P. McCabe, Bruce A. Craig
Publisher:W. H. Freeman