MATLAB: An Introduction with Applications
6th Edition
ISBN: 9781119256830
Author: Amos Gilat
Publisher: John Wiley & Sons Inc
expand_more
expand_more
format_list_bulleted
Concept explainers
Question
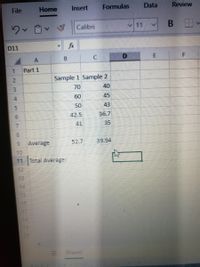
The average diameter for this population of 60 circles is 19.3. How many of your samples had an average diameter greater than 19.3? How many of your samples had an average diameter less than 19.3? How close is the “average of averages” you calculated to the population average of 19.3?

Transcribed Image Text:File
Home
Insert
Formulas
Data
Review
Calibri
v11
D11
fx
B.
Part 1
Sample 1 Sample 2
40
70
60
45
50
43
42.5
36.7
41
35
Average
52.7
39.94
11 Total Average:
12
14
15
16
18
19
20
Sheetl
7099
3.
Expert Solution
This question has been solved!
Explore an expertly crafted, step-by-step solution for a thorough understanding of key concepts.
This is a popular solution
Trending nowThis is a popular solution!
Step by stepSolved in 2 steps

Knowledge Booster
Learn more about
Need a deep-dive on the concept behind this application? Look no further. Learn more about this topic, statistics and related others by exploring similar questions and additional content below.Similar questions
- An automotive manufacturer wants to know the proportion of new car buyers who prefer foreign cars over domestic. Step 1 of 2 : Suppose a sample of 1217 new car buyers is drawn. Of those sampled, 267 preferred foreign over domestic cars. Using the data, estimate the proportion of new car buyers who prefer foreign cars. Enter your answer as a fraction or a decimal number rounded to three decimal places.arrow_forwardlikert scales are designed to be what in measurement?arrow_forwardThe state education commission wants to estimate the fraction of tenth grade students that have reading skills at or below the eighth grade level. Step 1 of 2: Suppose a sample of 333 tenth graders is drawn. Of the students sampled, 260 read above the eighth grade level. Using the data, estimate the proportion of tenth graders reading at or below the eighth grade level. Enter your answer as a fraction or a decimal number rounded to three decimal places. Step 2 of 2: Suppose a sample of 333 tenth graders is drawn. Of the students sampled, 260 read above the eighth grade level. Using the data, construct the 80% confidence interval for the population proportion of tenth graders reading at or below the eighth grade level. Round your answers to three decimal places.arrow_forward
- Betty, an employee of Shining Sun Daycare Centerread an article in Healthy Child Magazine sayingthat the average 3-year-old child is 37 in. tall.Betty works with 10 3-year-olds at Shining Sun,so later that week, she measured the height ofeach child who had just turned or was about toturn 3 years old. Here are the descriptive statisticsfor the sample: M = 35, s = 3.1. State the nondirectional hypothesis.2. Determine the critical t for a = .05.3. Calculate t. Show your calculations.4. Is the height of 3-year-olds in Shining SunDaycare Center significantly different fromthe height given in the magazine?arrow_forwardThe state education commission wants to estimate the fraction of tenth grade students that have reading skills at or below the eighth grade level. Step 1 of 2: Suppose a sample of 281 tenth graders is drawn. Of the students sampled, 56 read at or below the eighth grade level. Using the data, estimate the proportion of tenth graders reading at or below the eighth grade level. Enter your answer as a fraction or a decimal number rounded to three decimal places.arrow_forwardAn effect size of .55 would be considered?arrow_forward
arrow_back_ios
arrow_forward_ios
Recommended textbooks for you
 MATLAB: An Introduction with ApplicationsStatisticsISBN:9781119256830Author:Amos GilatPublisher:John Wiley & Sons Inc
 Probability and Statistics for Engineering and th...StatisticsISBN:9781305251809Author:Jay L. DevorePublisher:Cengage Learning
 Statistics for The Behavioral Sciences (MindTap C...StatisticsISBN:9781305504912Author:Frederick J Gravetter, Larry B. WallnauPublisher:Cengage Learning
 Elementary Statistics: Picturing the World (7th E...StatisticsISBN:9780134683416Author:Ron Larson, Betsy FarberPublisher:PEARSON
 The Basic Practice of StatisticsStatisticsISBN:9781319042578Author:David S. Moore, William I. Notz, Michael A. FlignerPublisher:W. H. Freeman
 Introduction to the Practice of StatisticsStatisticsISBN:9781319013387Author:David S. Moore, George P. McCabe, Bruce A. CraigPublisher:W. H. Freeman

MATLAB: An Introduction with Applications
Statistics
ISBN:9781119256830
Author:Amos Gilat
Publisher:John Wiley & Sons Inc

Probability and Statistics for Engineering and th...
Statistics
ISBN:9781305251809
Author:Jay L. Devore
Publisher:Cengage Learning

Statistics for The Behavioral Sciences (MindTap C...
Statistics
ISBN:9781305504912
Author:Frederick J Gravetter, Larry B. Wallnau
Publisher:Cengage Learning

Elementary Statistics: Picturing the World (7th E...
Statistics
ISBN:9780134683416
Author:Ron Larson, Betsy Farber
Publisher:PEARSON

The Basic Practice of Statistics
Statistics
ISBN:9781319042578
Author:David S. Moore, William I. Notz, Michael A. Fligner
Publisher:W. H. Freeman

Introduction to the Practice of Statistics
Statistics
ISBN:9781319013387
Author:David S. Moore, George P. McCabe, Bruce A. Craig
Publisher:W. H. Freeman