
MATLAB: An Introduction with Applications
6th Edition
ISBN: 9781119256830
Author: Amos Gilat
Publisher: John Wiley & Sons Inc
expand_more
expand_more
format_list_bulleted
Related questions
Question
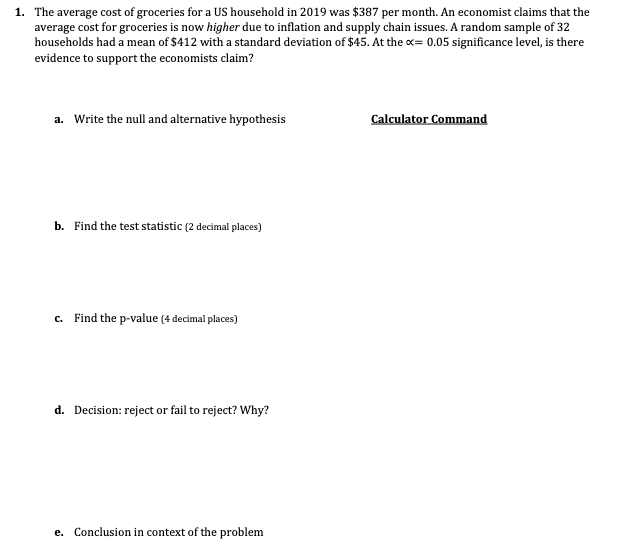

Transcribed Image Text:1. The average cost of groceries for a US household in 2019 was $387 per month. An economist claims that the
average cost for groceries is now higher due to inflation and supply chain issues. A random sample of 32
households had a mean of $412 with a standard deviation of $45. At the x= 0.05 significance level, is there
evidence to support the economists claim?
a. Write the null and alternative hypothesis
b. Find the test statistic (2 decimal places)
c. Find the p-value (4 decimal places)
d. Decision: reject or fail to reject? Why?
e. Conclusion in context of the problem
Calculator Command
Expert Solution
This question has been solved!
Explore an expertly crafted, step-by-step solution for a thorough understanding of key concepts.

Step by stepSolved in 3 steps with 3 images

Knowledge Booster

Similar questions
- A polling organization reported data from a survey of 2000 randomly selected Canadians who carry debit cards. Participants in this survey were asked what they considered the minimum purchase amount for which it would be acceptable to use a debit card. Suppose that the sample mean and standard deviation were $9.14 and $7.70, respectively. (These values are consistent with a histogram of the sample data that appears in the report.)Do these data provide convincing evidence that the mean minimum purchase amount for which Canadians consider the use of a debit card to be appropriate is less than $10? Carry out a hypothesis test with a significance level of 0.01. (Use a statistical computer package to calculate the P-value. Round your test statistic to two decimal places and your P-value to four decimal places.) t = P-value = State your conclusion. Reject H0. We do not have convincing evidence that the mean minimum purchase amount for which Canadians consider it…arrow_forwardStudents who graduated from college in 2010 owed an average of $25,000 in student loans. An economist wants to determine if average debt has changed. She takes a sample of 40 recent graduates and finds that their average debt is $27,500 with a population standard deviation of $9,120. Use 10% significance level to answer the following questions. a. Specify the competing hypotheses to test economists ‘claim. b. Calculate the value of the test statistic. c. Is the portfolio manager's claim substantiated by the data? Explain.arrow_forwardThe University of Montana admission standards require students to have an ACT score of at least 22. We know that Montana ACT scores are normally distributed with a mean of 20.1 and a standard deviation of 4. A: Students in Oregon have a mean ACT score of 21.1 with a standard deviation of 2.8. If we chose one student each at random from Oregon and from Montana, which student would be more likely to meet the ACT requirements of the University of Montana? Explain your answer using the appropriate statistics and a correctly labeled and shaded normal distribution. B: We know that the Montana ACT scores are normally distributed with a mean of 20.1 and a standard deviation of 4. Assume that the top 2% of individuals in the state are eligible for a state-funded scholarship. What score does an individual need on the ACT to be eligible? Explain your answer using the appropriate statistics and a correctly labeled and shaded normal distributionarrow_forward
- A hospital president claims that the average Salary of registered nurses at her hospital is more than $57,000. You test this claim by surveying 37 registered nurses at this hospital and find they have a mean salary of $57,425. Assume the population standard deviation is $1750 at the 0.10 level of significance is there enough evidence to support the claim of the hospital president?arrow_forward4. A medical statistician wants to estimate the average weight loss of people who are on a new diet plan. In a preliminary study, he guesses that the standard deviation of weight loss is about 10 pounds. How large a sample should he take to estimate the mean weight loss to within 2 pounds, with a 90% confidence.arrow_forwardThe average starting salary of students who graduated from colleges of Business in 2009 was $48,800. A sample of 100 graduates of 2010 showed an average starting salary of $50,000. Assume the standard deviation of the population is known to be $7000. We want to determine whether or not there has been a significant increase in the starting salaries. a. State the null and alternative hypotheses to be tested. b. Compute the test statistic. c. The null hypothesis is to be tested at the 5% level of significance. Determine the critical value for this test. d. What do you conclude from the test? e. What does the test result mean in the context of this problem?arrow_forward
- A random sample of 22 Midtown residents in Atlanta has been selected to be studied for their expenditure on theater tickets. The mean of spending for this group is $135 with a standard deviation of $39. The mean value of ticket expenditure in Atlanta that has been recorded for the past decade is $120. Discuss the below points: 1. What is the alternative hypothesis in this assignment? 2. Calculate the standard error of the mean for the study above. Please provide only typed answer solution no handwritten solution needed allowedarrow_forwardSuppose there is a city where the mean cost per month of a one-bedroom apartment is $1,500, with a standard deviation of $250. Approximately what percentage of one-bedroom apartments in the city cost between $750 and $1,000?arrow_forward
arrow_back_ios
arrow_forward_ios
Recommended textbooks for you
- MATLAB: An Introduction with ApplicationsStatisticsISBN:9781119256830Author:Amos GilatPublisher:John Wiley & Sons Inc
 Probability and Statistics for Engineering and th...StatisticsISBN:9781305251809Author:Jay L. DevorePublisher:Cengage Learning
 Statistics for The Behavioral Sciences (MindTap C...StatisticsISBN:9781305504912Author:Frederick J Gravetter, Larry B. WallnauPublisher:Cengage Learning
  Elementary Statistics: Picturing the World (7th E...StatisticsISBN:9780134683416Author:Ron Larson, Betsy FarberPublisher:PEARSON
 The Basic Practice of StatisticsStatisticsISBN:9781319042578Author:David S. Moore, William I. Notz, Michael A. FlignerPublisher:W. H. Freeman
 Introduction to the Practice of StatisticsStatisticsISBN:9781319013387Author:David S. Moore, George P. McCabe, Bruce A. CraigPublisher:W. H. Freeman
MATLAB: An Introduction with Applications
Statistics
ISBN:9781119256830
Author:Amos Gilat
Publisher:John Wiley & Sons Inc
Probability and Statistics for Engineering and th...
Statistics
ISBN:9781305251809
Author:Jay L. Devore
Publisher:Cengage Learning
Statistics for The Behavioral Sciences (MindTap C...
Statistics
ISBN:9781305504912
Author:Frederick J Gravetter, Larry B. Wallnau
Publisher:Cengage Learning
Elementary Statistics: Picturing the World (7th E...
Statistics
ISBN:9780134683416
Author:Ron Larson, Betsy Farber
Publisher:PEARSON
The Basic Practice of Statistics
Statistics
ISBN:9781319042578
Author:David S. Moore, William I. Notz, Michael A. Fligner
Publisher:W. H. Freeman
Introduction to the Practice of Statistics
Statistics
ISBN:9781319013387
Author:David S. Moore, George P. McCabe, Bruce A. Craig
Publisher:W. H. Freeman