MATLAB: An Introduction with Applications
6th Edition
ISBN: 9781119256830
Author: Amos Gilat
Publisher: John Wiley & Sons Inc
expand_more
expand_more
format_list_bulleted
Question

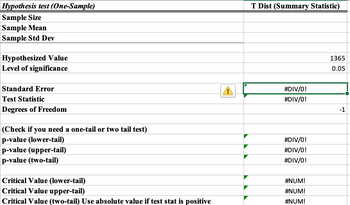
Transcribed Image Text:Hypothesis test (One-Sample)
Sample Size
Sample Mean
Sample Std Dev
Hypothesized Value
Level of significance
Standard Error
Test Statistic
Degrees of Freedom
(Check if you need a one-tail or two tail test)
p-value (lower-tail)
p-value (upper-tail)
p-value (two-tail)
Critical Value (lower-tail)
Critical Value upper-tail)
Critical Value (two-tail) Use absolute value if test stat is positive
T Dist (Summary Statistic)
#DIV/0!
#DIV/0!
#DIV/0!
#DIV/0!
#DIV/0!
#NUM!
#NUM!
#NUM!
1365
0.05
-1

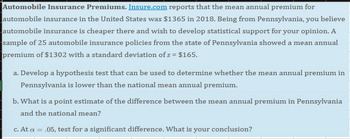
Transcribed Image Text:Automobile Insurance Premiums. Insure.com reports that the mean annual premium for
automobile insurance in the United States was $1365 in 2018. Being from Pennsylvania, you believe
automobile insurance is cheaper there and wish to develop statistical support for your opinion. A
sample of 25 automobile insurance policies from the state of Pennsylvania showed a mean annual
premium of $1302 with a standard deviation of s = $165.
a. Develop a hypothesis test that can be used to determine whether the mean annual premium in
Pennsylvania is lower than the national mean annual premium.
b. What is a point estimate of the difference between the mean annual premium in Pennsylvania
and the national mean?
c. At a = .05, test for a significant difference. What is your conclusion?
Expert Solution
This question has been solved!
Explore an expertly crafted, step-by-step solution for a thorough understanding of key concepts.
This is a popular solution
Trending nowThis is a popular solution!
Step by stepSolved in 2 steps

Knowledge Booster
Similar questions
- A company has rolled out a new process for sales people to use. They were able to go back into the company records and pull all sales data from before the roll out. Each sales person when they closed a sale had an average contract of $108 with a standard deviation of $12. During the first month after the roll out, a sample of sales showed the average contract was $116. Which statistical test could be used to see if this was a significant increase in contract size?arrow_forwardIn your work as a biomedical engineer, you need to better understand the distribution of adults' blood pressures. Specifically, you are interested in systolic blood pressure, which is a measure of pressure within arteries when a heart beats; this is the first number in a blood pressure reading. In healthy adults, systolic blood pressure has a normal distribution with a mean of 112 mm Hg and standard deviation of 10 mmHg. Before you collect sample data, you want to predict the range in which you expect almost all of the data to fall. Which of the following represents the interval that will likely contain almost all (~99.7%) of the sample measurements of healthy adult systolic blood pressure? A) (102 mm Hg, 122 mm Hg) B) (92 mm Hg, 132 mm Hg) C) (82 mm Hg, 142 mm Hg) D) (72 mm Hg, 152 mm Hg)arrow_forwardYou are applying for a job at two companies. Company A offers starting salaries with u = $33,000 and o = $1,000. Company B offers starting salaries with u = $33,000 and o = $3,000. From which company are you more likely to get an offer of $35,000 or more? Choose the correct answer below. O A. Company A, because data values that lie more than two standard deviations from the mean are considered unusual. O B. No difference, because data values that lie more than three standard deviations from the mean are considered very unusual. O C. Company B, because data values that lie within one standard deviation from the mean are not considered unusual.arrow_forward
- According to the U.S. Census, the average adult woman is the United States is 65 inches tall and the standard deviation is 3 inches. If Zsike is 67 inches tall, what is her z-score?arrow_forwardAccording to a health foundation survey from 2018 and 2016, the average annual premiums for employer-sponsored health insurance for family coverage was $16,834 in 2018 and $15,745 in 2016. Suppose the survey for 2018, was based on 250 employees who had employer-sponsored health insurance and the survey for 2016 was based on 200 employees who had employer-sponsored health insurance. Assume the population standard deviation for 2018 and 2016 were $2160 and $1990; respectively. Find a 97% confidence interval for the mean difference. (Round your answer to 1 decimal place.)Lower limit = Upper limit =arrow_forwardA hospital president claims that the average Salary of registered nurses at her hospital is more than $57,000. You test this claim by surveying 37 registered nurses at this hospital and find they have a mean salary of $57,425. Assume the population standard deviation is $1750 at the 0.10 level of significance is there enough evidence to support the claim of the hospital president?arrow_forward
- Choose the correct option and explain.arrow_forward77% of U.S. adults think that political correctness is a problem in America today. You randomly select six U.S. adults and ask them whether they think that political correctness is a problem in America today. The random variable represents the number of U.S. adults who think that political correctness is a problem in America today. Answer the questions below. What is the mean? What is the variance? what is the standard deviation? Interpret the resultsarrow_forwardYou may need to use the appropriate technology to answer this question. Data were collected on the top 1,000 financial advisers. Company A had 239 people on the list and another company, Company B, had 121 people on the list. A sample of 16 of the advisers from Company A and 10 of the advisers from Company B showed that the advisers managed many very large accounts with a large variance in the total amount of funds managed. The standard deviation of the amount managed by advisers from Company A was s₁ = $583 million. The standard deviation of the amount managed by advisers from Company B was s₂ = $484 million. Conduct a hypothesis test at a = 0.10 to determine if there is a significant difference in the population variances for the amounts managed by the two companies. What is your conclusion about the variability in the amount of funds managed by advisers from the two firms? State the null and alternative hypotheses. 2 2 H₂:0 2 Find the value of the test statistic. (Round your answer…arrow_forward
- It is known that average house prices today is $371,040 higher compared to 10 years ago and median in the current time also $382,000 higher than house prices 10 years ago. Provide an interpretation of the change of mean and median based on the information above. Compare and contrast these values and comment on the distribution of the increases in house prices.arrow_forwardAs reported in Runner's World magazine, the times of the finishers in the New York City 10- km run are normally distributed with mean 61 minutes and standard deviation 9 minutes. The 75th percentile for the finishing times is 67 minutes. What is the interpretation of this value?arrow_forwardAccording to the Vivino website, suppose the mean price for a bottle of red wine that scores 4.0 or higher on the Vivino Rating System is $32.48. A New England-based lifestyle magazine wants to determine if red wines of the same quality are less expensive in Providence, and it has collected prices for 64 randomly selected red wines of similar quality from wine stores throughout Providence. The mean and standard deviation for this sample are $30.15 and $12, respectively. (a) Develop appropriate hypotheses for a test to determine whether the sample data support the conclusion that the mean price in Providence for a bottle of red wine that scores 4.0 or higher on the Vivino Rating System is less than the population mean of $32.48. (Enter != for # as needed.) Ho: H: (b) Using the sample from the 64 bottles, what is the test statistic? (Round your answer to three decimal places.) Using the sample from the 64 bottles, what is the p-value? (Round your answer to four decimal places.) p-value =…arrow_forward
arrow_back_ios
SEE MORE QUESTIONS
arrow_forward_ios
Recommended textbooks for you
 MATLAB: An Introduction with ApplicationsStatisticsISBN:9781119256830Author:Amos GilatPublisher:John Wiley & Sons Inc
 Probability and Statistics for Engineering and th...StatisticsISBN:9781305251809Author:Jay L. DevorePublisher:Cengage Learning
 Statistics for The Behavioral Sciences (MindTap C...StatisticsISBN:9781305504912Author:Frederick J Gravetter, Larry B. WallnauPublisher:Cengage Learning
 Elementary Statistics: Picturing the World (7th E...StatisticsISBN:9780134683416Author:Ron Larson, Betsy FarberPublisher:PEARSON
 The Basic Practice of StatisticsStatisticsISBN:9781319042578Author:David S. Moore, William I. Notz, Michael A. FlignerPublisher:W. H. Freeman
 Introduction to the Practice of StatisticsStatisticsISBN:9781319013387Author:David S. Moore, George P. McCabe, Bruce A. CraigPublisher:W. H. Freeman

MATLAB: An Introduction with Applications
Statistics
ISBN:9781119256830
Author:Amos Gilat
Publisher:John Wiley & Sons Inc

Probability and Statistics for Engineering and th...
Statistics
ISBN:9781305251809
Author:Jay L. Devore
Publisher:Cengage Learning

Statistics for The Behavioral Sciences (MindTap C...
Statistics
ISBN:9781305504912
Author:Frederick J Gravetter, Larry B. Wallnau
Publisher:Cengage Learning

Elementary Statistics: Picturing the World (7th E...
Statistics
ISBN:9780134683416
Author:Ron Larson, Betsy Farber
Publisher:PEARSON

The Basic Practice of Statistics
Statistics
ISBN:9781319042578
Author:David S. Moore, William I. Notz, Michael A. Fligner
Publisher:W. H. Freeman

Introduction to the Practice of Statistics
Statistics
ISBN:9781319013387
Author:David S. Moore, George P. McCabe, Bruce A. Craig
Publisher:W. H. Freeman