
MATLAB: An Introduction with Applications
6th Edition
ISBN: 9781119256830
Author: Amos Gilat
Publisher: John Wiley & Sons Inc
expand_more
expand_more
format_list_bulleted
Related questions
Question
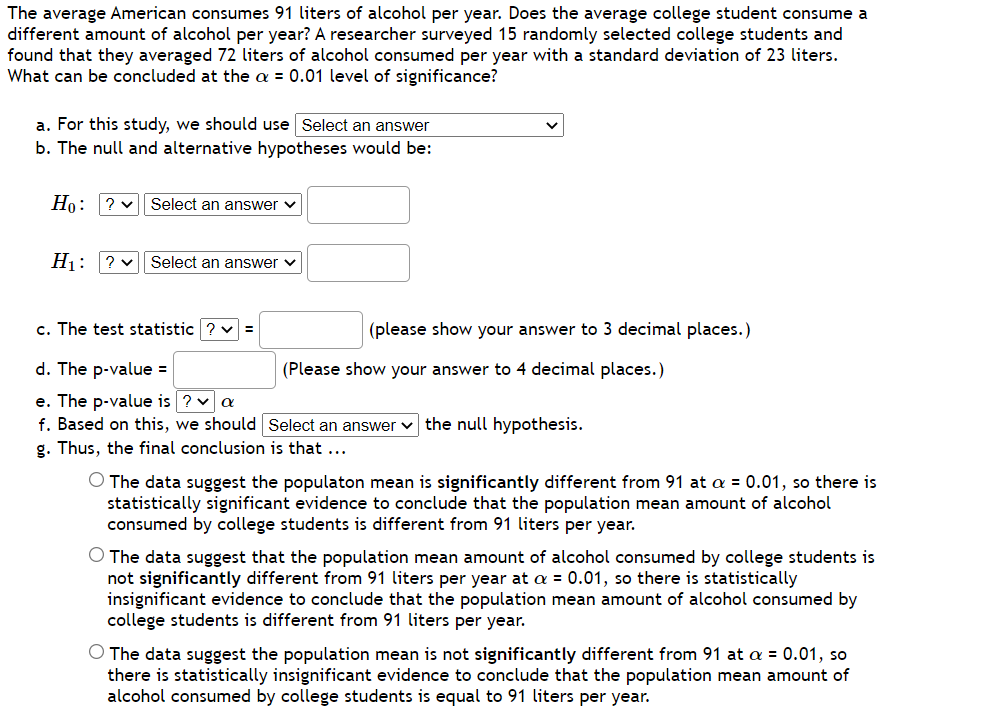

Transcribed Image Text:The average American consumes 91 liters of alcohol per year. Does the average college student consume a
different amount of alcohol per year? A researcher surveyed 15 randomly selected college students and
found that they averaged 72 liters of alcohol consumed per year with a standard deviation of 23 liters.
What can be concluded at the a = 0.01 level of significance?
a. For this study, we should use Select an answer
b. The null and alternative hypotheses would be:
Ho: ? v
Select an answer v
H: ? v | Select an answer v
c. The test statistic ?
(please show your answer to 3 decimal places.)
d. The p-value =
(Please show your answer to 4 decimal places.)
e. The p-value is ? v a
f. Based on this, we should Select an answer v the null hypothesis.
g. Thus, the final conclusion is that ...
O The data suggest the populaton mean is significantly different from 91 at a = 0.01, so there is
statistically significant evidence to conclude that the population mean amount of alcohol
consumed by college students is different from 91 liters per year.
O The data suggest that the population mean amount of alcohol consumed by college students is
not significantly different from 91 liters per year at a = 0.01, so there is statistically
insignificant evidence to conclude that the population mean amount of alcohol consumed by
college students is different from 91 liters per year.
The data suggest the population mean is not significantly different from 91 at a = 0.01, so
there is statistically insignificant evidence to conclude that the population mean amount of
alcohol consumed by college students is equal to 91 liters per year.
Expert Solution
This question has been solved!
Explore an expertly crafted, step-by-step solution for a thorough understanding of key concepts.

This is a popular solution

Trending nowThis is a popular solution!

Step by stepSolved in 2 steps

Knowledge Booster

Similar questions
- Use the following scenario to answer the next 6 questions. An engineer has designed a valve that will regulate water pressure on an automobile engine. The valve was tested on 30 engines and the mean pressure was 4.8 psi with a standard deviation of 1 psi. If the valve was designed to produce an overall mean pressure of 5.0 psi, is there sufficient evidence at the 10% level of significance that the valve performs below specifications? The appropriate hypothesis test for this scenario is: Group of answer choices right-tailed two-tailed left-tailedarrow_forwardThe coach of a very popular men’s basketball team claims that the average distance the fans travel to the campus to watch a game is 35 miles. The team members feel otherwise. A sample of 16 fans who travel to games was randomly selected and yielded a mean of M= 36 miles and s= 5 miles. Test the coach’s claim at the 5% (.05) level of significance. one-tailed or two-tailed test: State the hypotheses: df= tα or t value for the critical region = sM = t (test statistic)= Decision:arrow_forwardThe average American consumes 89 liters of alcohol per year. Does the average college student consume less alcohol per year? A researcher surveyed 15 randomly selected college students and found that they averaged 87.3 liters of alcohol consumed per year with a standard deviation of 15 liters. What can be concluded at the the a = 0.05 level of significance? a. For this study, we should use Select an answer b. The null and alternative hypotheses would be: Но: ? Select an answer V Н: ? v Select an answer V c. The test statistic ? v = (please show your answer to 3 decimal places.) d. The p-value = (Please show your answer to 4 decimal places.) e. The p-value is ? v a f. Based on this, we should Select an answer g. Thus, the final conclusion is that ... the null hypothesis. O The data suggest the population mean is not significantly less than 89 at a = 0.05, so there is statistically insignificant evidence to conclude that the population mean amount of alcohol consumed by college students…arrow_forward
- The average number of accidents at controlled intersections per year is 5.6. Is this average a different number for intersections with cameras installed? The 67 randomly observed intersections with cameras installed had an average of 5.8 accidents per year and the standard deviation was 0.6. What can be concluded at the a = 0.01 level of significance? a. For this study, we should use Select an answer b. The null and alternative hypotheses would be: Ho: ? v Select an answer v H1: ? v Select an answer V c. The test statistic ? V = (please show your answer to 3 decimal places.) d. The p-value = (Please show your answer to 4 decimal places.) e. The p-value is ? va f. Based on this, we should Select an answer g. Thus, the final conclusion is that ... the null hypothesis. The data suggest that the population mean is not significantly different from 5.6 at a = 0.01, so there is statistically insignificant evidence to conclude that the population mean number of accidents per year at…arrow_forwardAccording to a large oil company, the average cost per barrel of oil last year was $47. You believe that due to the current oil crisis in Russia and Iran that the cost of a barrel of oil has decreased. You collect a simple random sample of 60 barrels of oil and find an average price of $42 and a standard deviation of $12. Use this information to answer the following questions and conduct the hypothesis test with a level of significance of a = .01. You may use Statcrunch or a calculator. Write all non-calculation answers in complete sentences. a. Which test would you use and why? b. Write the null and alternative hypothesis in complete sentences. (Make sure you mark which is the null and which is the alternative.) c. Write the null and alternative hypothesis as symbols. d. State the requirements that have been met to run the test. e. What is the test statistic and the p-value? (Make sure you use the right notation.) f. Should you reject or fail to reject the null hypothesis? g. State…arrow_forwardSuppose the national average dollar amount for an automobile insurance claim is $670.543. You work for an agency in Michigan and you are interested in whether or not the state average is different from the national average. The hypotheses for this scenario are as follows: Null Hypothesis: μ = 670.543, Alternative Hypothesis: μ ≠ 670.543. A random sample of 27 claims shows an average amount of $668.645 with a standard deviation of $68.6867. What is the test statistic and p-value for this test? Question 8 options: 1) Test Statistic: -0.144, P-Value: 0.44345 2) Test Statistic: -0.144, P-Value: 0.5566 3) Test Statistic: -0.144, P-Value: 1.5566 4) Test Statistic: 0.144, P-Value: 0.8869 5) Test Statistic: -0.144, P-Value: 0.8869arrow_forward
- The average salary for American college graduates is $44,300. You suspect that the average is different for graduates from your college. The 61 randomly selected graduates from your college had an average salary of $44,099 and a standard deviation of $4,460. What can be concluded at the a = 0.10 level of significance? a. For this study, we should useSelect an answer b. The null and alternative hypotheses would be: Họ: vSelect an answer H: ? vSelect an answer c. The test statistic (please show your answer to 3 decimal places.) d. The p-value = (Please show your answer to 4 decimal places.) e. The p-value is va the null hypothesis. f. Based on this, we should Select an answer g. Thus, the final conclusion is that ... O The data suggest that the population mean is not significantly different from 44,300 at a = 0.10, so there is statistically insignificant evidence to conclude that the population mean salary for graduates from your college is different from 44,300. The data suggest that…arrow_forwardThe College Board reports that the scores on the math SAT were normally distributed with a mean of 525. A random sample of 15 students at your high school had a mean of 550 and a sample standard deviation of 105. What values of the sample mean would lead to rejection of the null hypothesis at the 0.01 level of significance?arrow_forwardWe want to conduct a hypothesis test of the claim that for middle-aged adults the population's mean of their cholesterol levels is more than 199.3 mgdL. We choose a random sample of such levels. The sample has a mean of 197.3 mgdL and a standard deviation of 19.5 mgdL. For each of the following sampling scenarios, choose an appropriate test statistic for our hypothesis test on the population mean. Then calculate that statistic. Round your answers to two decimal places. (a) The sample has size 105, and it is from a non-normally distributed population with a known standard deviation of 19.2. z = t = It is unclear which test statistic to use. (b) The sample has size 12, and it is from a normally distributed population with an unknown standard deviation. z = t = It is unclear which test statistic to use.arrow_forward
- The mean number of eggs per person eaten in the United States is 255. Do college students eat less eggs than the average American? The 68 college students surveyed averaged 246 eggs per person and their standard deviation was 30.5. What can be concluded at the a = 0.05 level of significance? a. For this study, we should use Select an answer b. The null and alternative hypotheses would be: Ho: ?v Select an answer v Select an answer Y c. The test statistic ? (please show your answer to 3 decimal places.) d. The p-value = (Please show your answer to 4 decimal places.) e. The p-value is ? v f. Based on this, we should Select an answer v the null hypothesis.arrow_forwardThe manufacturer claims that your new car gets 23 mpg on the highway. You suspect that the mpg is less for your car. The 50 trips on the highway that you took averaged 19.8 mpg and the standard deviation for these 50 trips was 7.4 mpg. What can be concluded at the � = 0.10 level of significance? For this study, we should use The null and alternative hypotheses would be: �0: �1: The test statistic = (please show your answer to 3 decimal places.) The p-value = (Please show your answer to 4 decimal places.) The p-value is � Based on this, we should the null hypothesis. Thus, the final conclusion is that ... The data suggest that the populaton mean is significantly less than 23 at � = 0.10, so there is statistically significant evidence to conclude that the population mean mpg for your car on the highway is less than 23. The data suggest that the population mean is not significantly less than 23 at � = 0.10, so there is…arrow_forwardA sample of 42 observations is selected from one population with a population standard deviation of 4.5. The sample mean is 100.5. A sample of 56 observations is selected from a second population with a population standard deviation of 3.8. The sample mean is 98.5. Conduct the following test of hypothesis using the 0.10 significance level. H₂ H₁ H₂ H₁ H₁ H₂ a. Is this a one-tailed or a two-tailed test? O One-tailed test O Two-tailed test b. State the decision rule. (Negative values should be indicated by a minus sign. Round your answers to 2 decimal places.) The decision rule is to reject H0 if z is the interval (arrow_forward
arrow_back_ios
SEE MORE QUESTIONS
arrow_forward_ios
Recommended textbooks for you
- MATLAB: An Introduction with ApplicationsStatisticsISBN:9781119256830Author:Amos GilatPublisher:John Wiley & Sons Inc
 Probability and Statistics for Engineering and th...StatisticsISBN:9781305251809Author:Jay L. DevorePublisher:Cengage Learning
 Statistics for The Behavioral Sciences (MindTap C...StatisticsISBN:9781305504912Author:Frederick J Gravetter, Larry B. WallnauPublisher:Cengage Learning
  Elementary Statistics: Picturing the World (7th E...StatisticsISBN:9780134683416Author:Ron Larson, Betsy FarberPublisher:PEARSON
 The Basic Practice of StatisticsStatisticsISBN:9781319042578Author:David S. Moore, William I. Notz, Michael A. FlignerPublisher:W. H. Freeman
 Introduction to the Practice of StatisticsStatisticsISBN:9781319013387Author:David S. Moore, George P. McCabe, Bruce A. CraigPublisher:W. H. Freeman
MATLAB: An Introduction with Applications
Statistics
ISBN:9781119256830
Author:Amos Gilat
Publisher:John Wiley & Sons Inc
Probability and Statistics for Engineering and th...
Statistics
ISBN:9781305251809
Author:Jay L. Devore
Publisher:Cengage Learning
Statistics for The Behavioral Sciences (MindTap C...
Statistics
ISBN:9781305504912
Author:Frederick J Gravetter, Larry B. Wallnau
Publisher:Cengage Learning
Elementary Statistics: Picturing the World (7th E...
Statistics
ISBN:9780134683416
Author:Ron Larson, Betsy Farber
Publisher:PEARSON
The Basic Practice of Statistics
Statistics
ISBN:9781319042578
Author:David S. Moore, William I. Notz, Michael A. Fligner
Publisher:W. H. Freeman
Introduction to the Practice of Statistics
Statistics
ISBN:9781319013387
Author:David S. Moore, George P. McCabe, Bruce A. Craig
Publisher:W. H. Freeman