
MATLAB: An Introduction with Applications
6th Edition
ISBN: 9781119256830
Author: Amos Gilat
Publisher: John Wiley & Sons Inc
expand_more
expand_more
format_list_bulleted
Related questions
Question
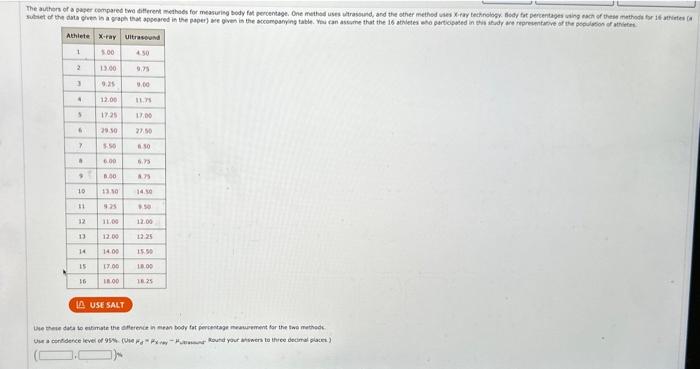

Transcribed Image Text:The authors of a paper compared two different methods for measuring body fat percentage. One method uses ultrasound, and the other method uses X-ray technology Body fat percentages using each of these methods for 16 athletes (
subset of the data given in a graph that appeared in the paper) are given in the accompanying table. You can assume that the 16 athletes who participated in this study are representative of the population of athletes
Athlete X-ray
1
1.00
13.00
9.25
2
3
4
6
7
.
9
------
11
13
10 13.30
14
12.00
17:25
15
16
29.30
5.50
6.00
6.00
925
11.00
12.00
14.00
17.00
18.00
Ultrasound
4.50
9,00
11.75
17.00
27.50
8.30
6.75
8.75
14.50
9.50
12.00
12:25
15.50
18.00
18.25
LA USE SALT
Use these data to estimate the difference in mean body fat percentage measurement for the two methods.
Use a confidence level of 95% (Use Pound your answers to three decimal places)
Expert Solution
This question has been solved!
Explore an expertly crafted, step-by-step solution for a thorough understanding of key concepts.

This is a popular solution

Trending nowThis is a popular solution!

Step by stepSolved in 4 steps

Knowledge Booster

Similar questions
- please show the work for the problems with an explanation versus just shwoing calculated data.arrow_forwardPart 4 of 4 Summarize the results. There (Choose one) enough evidence to conclude that the second-graders in the superintendent's school district have h the nationwide average. differe is is notarrow_forwardDescribe the descriptive statistics between the two variables.arrow_forward
- Please box every answrarrow_forwardThe blue catfish (Ictalurus Furcatus) is the largest species of North Amercian catfish. The current world record stands at 143 pounds, which was caught in the John H. Kerr Reservoir (Bugg's Island Lake) located in Virginia. According to Amercian Expedition, the average weight of a blue catfish is between 20 to 40 pounds. Given that the largest blue catfish ever caught was at the John H. Kerr Reservoir, you believe that the mean weight of the fish in this reservoir is greater than 40 pounds. If you are going to test this claim, what would be your null and alternative hypotheses? Но: (? На: (?arrow_forwardplease answer blank questions only and or ones with a red x next to them.arrow_forward
- What type of data would you use for collecting data on lap swim time?arrow_forwardPlease help me with the following sections: d, e, f, g, h and i Thank you!arrow_forwardResearchers Holdgate et al. (2016) studied walking behavior of elephants in North American zoos to see if there is a difference in average distance traveled by African and Asian elephants. They put GPS loggers on 33 African elephants and 23 Asian elephants and measured the distance (in kilometers) the elephants walked per day. The data in the file below Elephants contains results that are consistent with what the researchers found: Species Distance: African 6.12 African 3.65 African 4.26 African 3.8 African 5.23 African 5.02 African 5.17 African 5.37 African 4.89 African 6.4 African 6.42 African 6.85 African 3.38 African 7.71 African 4.02 African 3.52 African 5.81 African 5.83 African 7.02 African 6.11 African 4.62 African 5.54 African 3.2 African 5.49 African 5.47 African 6.97 African 3.74 African 3.04 African 7.84 African 8.62 African 7.63 African 5.25 African 4.19 Asian 1.39 Asian 2.59 Asian 8.03 Asian 7.93 Asian 0.33 Asian 8.22 Asian 6.95 Asian 2.39 Asian 3.89 Asian 10.53 Asian…arrow_forward
arrow_back_ios
SEE MORE QUESTIONS
arrow_forward_ios
Recommended textbooks for you
- MATLAB: An Introduction with ApplicationsStatisticsISBN:9781119256830Author:Amos GilatPublisher:John Wiley & Sons Inc
 Probability and Statistics for Engineering and th...StatisticsISBN:9781305251809Author:Jay L. DevorePublisher:Cengage Learning
 Statistics for The Behavioral Sciences (MindTap C...StatisticsISBN:9781305504912Author:Frederick J Gravetter, Larry B. WallnauPublisher:Cengage Learning
  Elementary Statistics: Picturing the World (7th E...StatisticsISBN:9780134683416Author:Ron Larson, Betsy FarberPublisher:PEARSON
 The Basic Practice of StatisticsStatisticsISBN:9781319042578Author:David S. Moore, William I. Notz, Michael A. FlignerPublisher:W. H. Freeman
 Introduction to the Practice of StatisticsStatisticsISBN:9781319013387Author:David S. Moore, George P. McCabe, Bruce A. CraigPublisher:W. H. Freeman
MATLAB: An Introduction with Applications
Statistics
ISBN:9781119256830
Author:Amos Gilat
Publisher:John Wiley & Sons Inc
Probability and Statistics for Engineering and th...
Statistics
ISBN:9781305251809
Author:Jay L. Devore
Publisher:Cengage Learning
Statistics for The Behavioral Sciences (MindTap C...
Statistics
ISBN:9781305504912
Author:Frederick J Gravetter, Larry B. Wallnau
Publisher:Cengage Learning
Elementary Statistics: Picturing the World (7th E...
Statistics
ISBN:9780134683416
Author:Ron Larson, Betsy Farber
Publisher:PEARSON
The Basic Practice of Statistics
Statistics
ISBN:9781319042578
Author:David S. Moore, William I. Notz, Michael A. Fligner
Publisher:W. H. Freeman
Introduction to the Practice of Statistics
Statistics
ISBN:9781319013387
Author:David S. Moore, George P. McCabe, Bruce A. Craig
Publisher:W. H. Freeman