MATLAB: An Introduction with Applications
6th Edition
ISBN: 9781119256830
Author: Amos Gilat
Publisher: John Wiley & Sons Inc
expand_more
expand_more
format_list_bulleted
Question
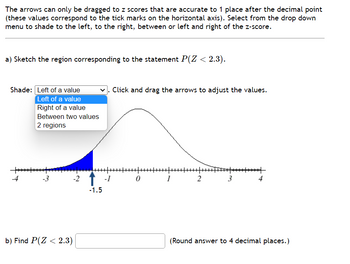
The arrows can only be dragged to z scores that are accurate to 1 place after the decimal point (these values correspond to the tick marks on the horizontal axis). Select from the drop down menu to shade to the left, to the right, between or left and right of the z-score.
a) Sketch the region corresponding to the statement �(�<2.3).
Shade: . Click and drag the arrows to adjust the values.
please sketch correctly like in the image

Transcribed Image Text:The arrows can only be dragged to z scores that are accurate to 1 place after the decimal point
(these values correspond to the tick marks on the horizontal axis). Select from the drop down
menu to shade to the left, to the right, between or left and right of the z-score.
a) Sketch the region corresponding to the statement P(Z < 2.3).
Shade: Left of a value
Left of a value
Right of a value
Between two values
2 regions
++++++++
+
بنا
-2
b) Find P(Z < 2.3)
-1.5
-1
Click and drag the arrows to adjust the values.
+|+++++
0
2
HHT
3
4
(Round answer to 4 decimal places.)
Expert Solution
This question has been solved!
Explore an expertly crafted, step-by-step solution for a thorough understanding of key concepts.
This is a popular solution
Trending nowThis is a popular solution!
Step by stepSolved in 2 steps with 1 images

Knowledge Booster
Similar questions
- Consider the image. Which computations use the change in the right triangles to show that the slope of the line along the orange triangle is the same as the slope of the line along the yellow triangle? *arrow_forwardPlease do not give solution in image formate In the United States, the average baby birth weight is 7 pounds (st. dev = 1). You are a community health care provider working is rural Texas and you are concerned that the pregnant mothers may not be getting the right prenatal care because it seems that their babies are born weighing less than average. In a given rural hospital sample, the mean birth weight is 6.4 pounds for 36 babies this year. Should you be concerned?arrow_forwardA line passes through the points (10,16) and (15, 24). Can the relationship be modeled by a graph of direct variation? Explain in complete sentences how you arrived at your answer. Use complete sentences.arrow_forward
Recommended textbooks for you
 MATLAB: An Introduction with ApplicationsStatisticsISBN:9781119256830Author:Amos GilatPublisher:John Wiley & Sons Inc
 Probability and Statistics for Engineering and th...StatisticsISBN:9781305251809Author:Jay L. DevorePublisher:Cengage Learning
 Statistics for The Behavioral Sciences (MindTap C...StatisticsISBN:9781305504912Author:Frederick J Gravetter, Larry B. WallnauPublisher:Cengage Learning
 Elementary Statistics: Picturing the World (7th E...StatisticsISBN:9780134683416Author:Ron Larson, Betsy FarberPublisher:PEARSON
 The Basic Practice of StatisticsStatisticsISBN:9781319042578Author:David S. Moore, William I. Notz, Michael A. FlignerPublisher:W. H. Freeman
 Introduction to the Practice of StatisticsStatisticsISBN:9781319013387Author:David S. Moore, George P. McCabe, Bruce A. CraigPublisher:W. H. Freeman

MATLAB: An Introduction with Applications
Statistics
ISBN:9781119256830
Author:Amos Gilat
Publisher:John Wiley & Sons Inc

Probability and Statistics for Engineering and th...
Statistics
ISBN:9781305251809
Author:Jay L. Devore
Publisher:Cengage Learning

Statistics for The Behavioral Sciences (MindTap C...
Statistics
ISBN:9781305504912
Author:Frederick J Gravetter, Larry B. Wallnau
Publisher:Cengage Learning

Elementary Statistics: Picturing the World (7th E...
Statistics
ISBN:9780134683416
Author:Ron Larson, Betsy Farber
Publisher:PEARSON

The Basic Practice of Statistics
Statistics
ISBN:9781319042578
Author:David S. Moore, William I. Notz, Michael A. Fligner
Publisher:W. H. Freeman

Introduction to the Practice of Statistics
Statistics
ISBN:9781319013387
Author:David S. Moore, George P. McCabe, Bruce A. Craig
Publisher:W. H. Freeman