
MATLAB: An Introduction with Applications
6th Edition
ISBN: 9781119256830
Author: Amos Gilat
Publisher: John Wiley & Sons Inc
expand_more
expand_more
format_list_bulleted
Related questions
Question
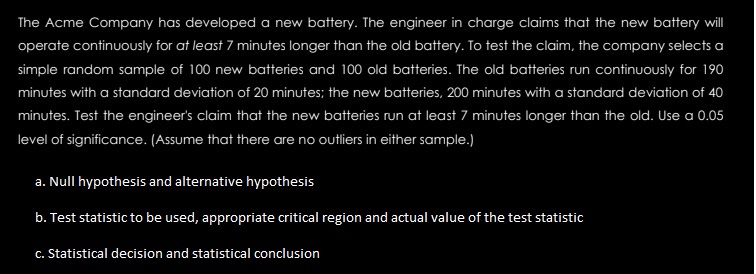

Transcribed Image Text:The Acme Company has developed a new battery. The engineer in charge claims that the new battery will
operate continuously for at least 7 minutes longer than the old battery. To test the claim, the company selects a
simple random sample of 100 new batteries and 100 old batteries. The old batteries run continuously for 190
minutes with a standard deviation of 20 minutes; the new batteries, 200 minutes with a standard deviation of 40
minutes. Test the engineer's claim that the new batteries run at least 7 minutes longer than the old. Use a 0.05
level of significance. (Assume that there are no outliers in either sample.)
a. Null hypothesis and alternative hypothesis
b. Test statistic to be used, appropriate critical region and actual value of the test statistic
c. Statistical decision and statistical conclusion
Expert Solution
This question has been solved!
Explore an expertly crafted, step-by-step solution for a thorough understanding of key concepts.

This is a popular solution

Trending nowThis is a popular solution!

Step by stepSolved in 4 steps with 1 images

Knowledge Booster

Similar questions
- Paint used to paint lines on roads must reflect enough light to be clearly visible at night. Researchers have 2 new types of paints they want to test paint type A and paint type B. For each paint type, they tested if there was statistical evidence the average reflectometer reading is greater than 35. To test each type of paint, they used 15 paint samples. Further, suppose the standard deviation is the same for both types of paints. The sample mean for paint type A was 39 and the sample mean for paint type B was 41.5. For both statistical tests, the significance level is set to .05.Which of the following is true? If they fail to reject the null hypothesis for paint type A we can conclude there is statistical evidence the average reflectometer for type A paint is 35. The p-value for the type B paint test is smaller. They rejected the null hypothesis for both paint types. Exactly two of the statements above are true. None are true.arrow_forwardA prominent medical group claims that the population mean of the surgery durations for all brain tumor patients is 3.69 hours. You are a data analyst for a health insurance company and want to test that claim. To do so, you select a random sample of 32 brain tumor surgery patients, and you record the surgery duration for each. Assume it is known that the population standard deviation of the durations of all brain tumor surgeries is 1.68 hours. Based on your sample, follow the steps below to construct a 99% confidence interval for the population mean of the surgery durations for all brain tumor patients. Then state whether the confidence interval you construct contradicts the medical group's claim. (If necessary, consult a list of formulas.) (a) Click on "Take Sample" to see the results from your random sample of 32 brain tumor patients. (b) (c) Take Sample Sample size: Point estimate: Population standard deviation: Critical value: Compute 0.00 0.00 Number of patients Enter the values…arrow_forwardIt currently takes users a mean of 12 minutes to install the most popular computer program made by RodeTech, a software design company. After changes have been made to the program, the company executives want to know if the new mean is now different from 12 minutes so that they can change their advertising accordingly. A simple random sample of 91 new customers are asked to time how long it takes for them to install the software. The sample mean is 11.7 minutes with a standard deviation of 1.6 minutes. Perform a hypothesis test at the 0.05 level of significance to see if the mean installation time has changed. Step 2 of 3 : Compute the value of the test statistic. Round your answer to three decimal places.arrow_forward
- Fran is training for her first marathon, and she wants to know if there is a significant difference between the mean number of miles run each week by group runners and individual runners who are training for marathons. She interviews 42 randomly selected people who train in groups and finds that they run a mean of 47.1 miles per week. Assume that the population standard deviation for group runners is known to be 4.4 miles per week. She also interviews a random sample of 47 people who train on their own and finds that they run a mean of 48.5 miles per week. Assume that the population standard deviation for people who run by themselves is 1.8 miles per week. Test the claim at the 0.01 level of significance. Let group runners training for marathons be Population 1 and let individual runners training for marathons be Population 2. Step 2 of 3 : Compute the value of the test statistic. Round your answer to two decimal places.arrow_forwardThe null hypothesis: H, :0 The alternative hypothesis: H :0 The type of test statistic: (Choose one) v The value of the test statistic: (Round to at least three decimal places.) The critical value at the 0.05 level of significance: (Round to at least three decimal places.) Can we support the claim that the life expectancy in the United States is greater than the life expectancy in Ireland? O Yes Noarrow_forwardNintendo is doing a classic game competition for the anniversary of Super Mario Bros. The average runtime for a straight playthrough is 1 hour and 58 minutes (with a standard deviation of 6 minutes). Out of all of the players who compete in this competition (120 players), the fastest 10% will get a chance at a special reward. What would be the benchmark playthrough time for this competition?arrow_forward
- The human resources department of a consulting firm gives a standard creativity test to a randomly selected group of new hires every year. This year, 100 new hires took the test and scored a mean of 113.6 points with a standard deviation of 134. Last year, 95 new hires took the test and scored a mean of 116.4 points with a standard deviation of 16.8. Assume that the population standard deviations of the test scores of all new hires in the current year and the test socores of all new hires last year can be estimated by the sample standard deviations, as the samples used were quite large. Construct a 90 confidence interval for the difference between the mean test score , of new hires from the current year and the mean test score , of new hires from last year. Then tind the lower limit and upper limit of the 905% confidence interval. Carry your intermediate computations to at least three decimal places. Round your answeis to at least two decimal places. (If necessary, cosult a list.ot…arrow_forwardTwo estimates are available for the same population parameter. Estimate one has a standard deviation of 8.5 and estimate two has a standard deviation of 8.7. Estimate two is unbiased, whereas estimate one is biased. Which estimate would you choose and why?arrow_forwardAccording to the historical data, the life expectancy in the United States is less than or equal to the life expectancy in Ireland. A new study has been made to see whether this has changed. Records of 235 individuals from the United States who died recently are selected at random. The 235 individuals lived an average of 77.6 years with a standard deviation of 6.7 years. Records of 220 individuals from Ireland who died recently are selected at random and independently. The 220 individuals lived an average of 76.3 years with a standard deviation of 5.5 years. Assume that the population standard deviations of the life expectancies can be estimated by the sample standard deviations, since the samples that are used to compute them are quite large. At the 0.1 level of significance, is there enough evidence to support the claim that the life expectancy, u,, in the United States is greater than the life expectancy, µ, in Ireland? Perform a one-tailed test. Then fill in the table below. Carry…arrow_forward
- Two chemical companies can supply a raw material. The concentration of a particular element in this material is important. The mean concentration for both suppliers is the same, but you suspect that the variability in concentration may differ for the two companies. The standard deviation of concentration in a random sample of n₁ = 10 batches produced by company 1 is s₁ = 4.7 grams per liter, and for company 2, a random sample of n₂ = 16 batches yield s₂ = 5.8 grams per liter. Is there sufficient evidence to conclude that the two populations variances differ? Use a = 0.05. a. Because 0.321 < 0.657 <3.77, fail to reject the null hypothesis b. Because 0.265 < 0.657 <3.12, fail to reject the null hypothesis c. Because 0.386 < 0.657 <3.01, fail to reject the null hypothesis d. None among the choicesarrow_forwardA newly hired basketball coach promised a high- paced attack that will put more points on the board than the team's previously tepid offense historically managed. After a few months, the team owner looks at the data to test the coach's claim. He takes a sample of 36 of the team's games under the new coach and finds that they scored an average of 101 points with a standard deviation of 6 points. Over the past 10 years, the team had averaged 99 points. What is(are) the appropriate critical value(s) to test the new coach's claim at the 1% significance level? -2.438 -2.438 and 2.438 2.326 2.438arrow_forwardtimes for a surgical procedure are normally distributed. there are two methods. method a has a mean of 29 minutes and a standard deviation of 5 minutes, while method b has a mean of 33 minutes and a standard deviation of 25 minutes. which procedure is preferred if the procedure must be completed within 37 minutes. method a, b, or either methodarrow_forward
arrow_back_ios
arrow_forward_ios
Recommended textbooks for you
- MATLAB: An Introduction with ApplicationsStatisticsISBN:9781119256830Author:Amos GilatPublisher:John Wiley & Sons Inc
 Probability and Statistics for Engineering and th...StatisticsISBN:9781305251809Author:Jay L. DevorePublisher:Cengage Learning
 Statistics for The Behavioral Sciences (MindTap C...StatisticsISBN:9781305504912Author:Frederick J Gravetter, Larry B. WallnauPublisher:Cengage Learning
  Elementary Statistics: Picturing the World (7th E...StatisticsISBN:9780134683416Author:Ron Larson, Betsy FarberPublisher:PEARSON
 The Basic Practice of StatisticsStatisticsISBN:9781319042578Author:David S. Moore, William I. Notz, Michael A. FlignerPublisher:W. H. Freeman
 Introduction to the Practice of StatisticsStatisticsISBN:9781319013387Author:David S. Moore, George P. McCabe, Bruce A. CraigPublisher:W. H. Freeman
MATLAB: An Introduction with Applications
Statistics
ISBN:9781119256830
Author:Amos Gilat
Publisher:John Wiley & Sons Inc
Probability and Statistics for Engineering and th...
Statistics
ISBN:9781305251809
Author:Jay L. Devore
Publisher:Cengage Learning
Statistics for The Behavioral Sciences (MindTap C...
Statistics
ISBN:9781305504912
Author:Frederick J Gravetter, Larry B. Wallnau
Publisher:Cengage Learning
Elementary Statistics: Picturing the World (7th E...
Statistics
ISBN:9780134683416
Author:Ron Larson, Betsy Farber
Publisher:PEARSON
The Basic Practice of Statistics
Statistics
ISBN:9781319042578
Author:David S. Moore, William I. Notz, Michael A. Fligner
Publisher:W. H. Freeman
Introduction to the Practice of Statistics
Statistics
ISBN:9781319013387
Author:David S. Moore, George P. McCabe, Bruce A. Craig
Publisher:W. H. Freeman