
MATLAB: An Introduction with Applications
6th Edition
ISBN: 9781119256830
Author: Amos Gilat
Publisher: John Wiley & Sons Inc
expand_more
expand_more
format_list_bulleted
Related questions
Concept explainers
Question
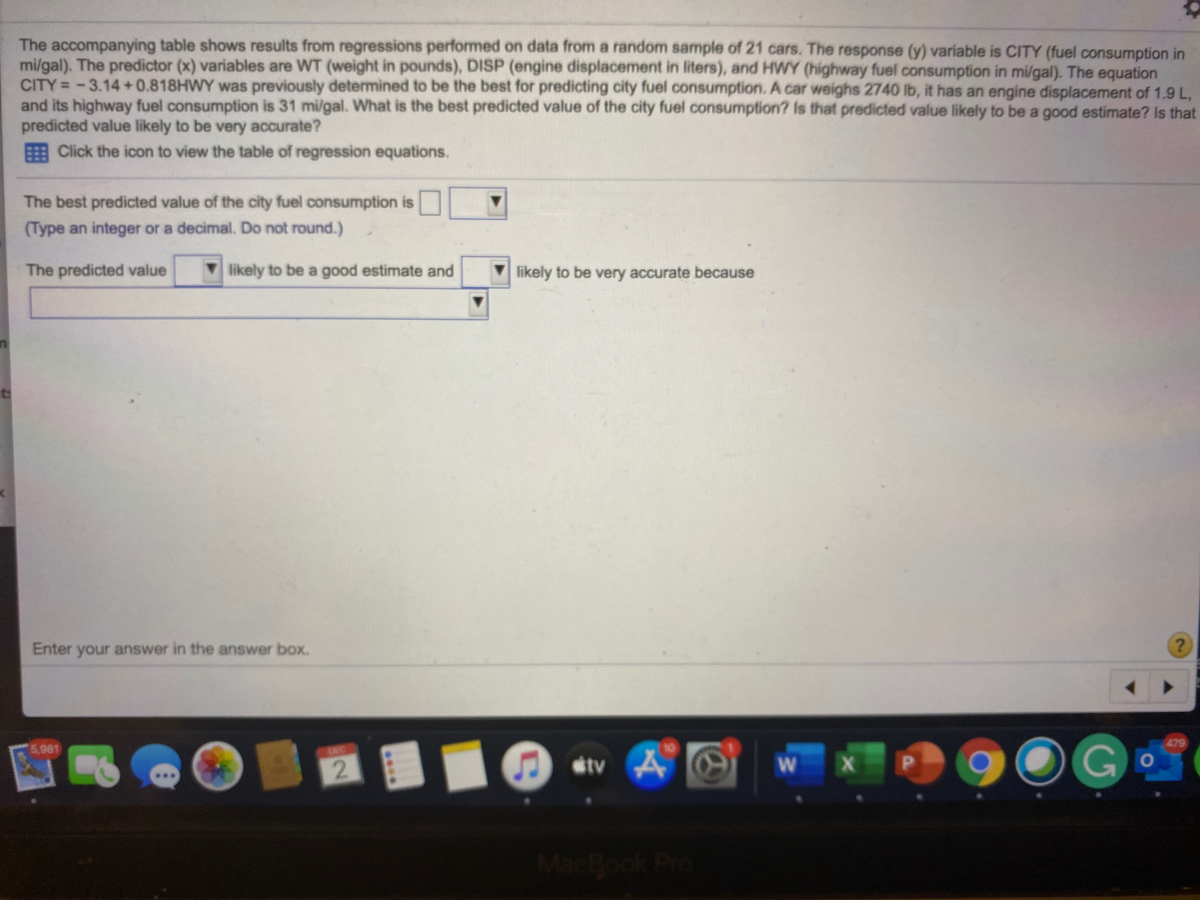

Transcribed Image Text:The accompanying table shows results from regressions performed on data from a random sample of 21 cars. The response (y) variable is CITY (fuel consumption in
mi/gal). The predictor (x) variables are WT (weight in pounds), DISP (engine displacement in liters), and HWY (highway fuel consumption in mi/gal). The equation
CITY = -3.14 +0.818HWY was previously determined to be the best for predicting city fuel consumption. A car weighs 2740 lb, it has an engine displacement of 1.9 L,
and its highway fuel consumption is 31 mi/gal. What is the best predicted value of the city fuel consumption? Is that predicted value likely to be a good estimate? Is that
predicted value likely to be very accurate?
E Click the icon to view the table of regression equations.
The best predicted value of the city fuel consumption is
(Type an integer or a decimal. Do not round.)
The predicted value
V likely to be a good estimate and
likely to be very accurate because
Enter your answer in the answer box.
5,981
étv 4
G
MacBook Pro

Transcribed Image Text:he icon to view the table of regression equations.
The best predicted
Regression Table
(Type an integer of
The predicted valu
Predictor (x) Variables P-Value
R2
Adjusted R2
0.943
Regression Equation
CITY = 6.82-0.00127WT – 0.256DISP + 0.653HWY
CITY = 38.5 -0.00156WT -1.26DISP
WT/DISP/HWY
0.000
0.933
WT/DISP
0.000
0.748
0.720
WT/HWY
0.000
0.942
0.936
CITY = 6.75 -0.00156WT +0.672HWY
DISP/HWY
0.000
0.934
0.927
CITY = 1.88 –0.622DISP + 0.702HWY
WT
0.000
0.711
0.696
CITY = 41.5 -0.00605WT
DISP
0.000
0.659
0.925
0.641
CITY = 29.5 -3.01DISP
HWY
0.000
0.921
CITY = - 3.14 +0.818HWY
Print
Done
Enter your answer in the answer box.
5,981
DEC
10
tv
W
X
MacBook Pro
Expert Solution
This question has been solved!
Explore an expertly crafted, step-by-step solution for a thorough understanding of key concepts.

This is a popular solution

Trending nowThis is a popular solution!

Step by stepSolved in 2 steps with 1 images

Knowledge Booster


Learn more about
Need a deep-dive on the concept behind this application? Look no further. Learn more about this topic, statistics and related others by exploring similar questions and additional content below.Similar questions
- The table below gives the age and bone density for 5 women. Use the equation of the regression line, y= b0 + b1x, for predicting a women's bone density based on her age. The correlation coefficient may or may not be statically significant for the data given. Remember it wouldn't be appropiate to use regression line to make a prediction if the correlation coefficient isn;t statically significant. (y has a "hat" on the top) age 39 51 54 56 67 bone density 355 349 347 315 313 Find the estimated slope. Rund your answer to three decimal places. Find the estimated y-intercept. Round your answer to three decimal places. Determine the value of the dependent variable y at x+ 0 (y has a "hat" onthe top) Find the estimated value of y when x = 51. Round your answer to three decimal places. Substitute the values you found in steps 1 and 2 into the equation for the regression line to find the estimated linear model. According to this model, if the valueof the…arrow_forwardA random sample of college students was surveyed about how they spend their time each week. The scatterplot below displays the relationship between the number of hours each student typically works per week at a part- or full-time job and the number of hours of television each student typically watches per week. The correlation between these variables is r = –0.63, and the equation we would use to predict hours spent watching TV based on hours spent working is as follows: Predicted hours spent watching TV = 17.21 – 0.23(hours spent working) Since we are using hours spent working to help us predict hours spent watching TV, we’d call hours spent working a(n) __________________ variable and hours spent watching TV a(n) __________________ variable. The correlation coefficient, along with what we see in the scatterplot, tells us that the relationship between the variables has a direction that is _________________ and a strength that is ______________________. According to the…arrow_forwardListed below are foot lengths (mm) and heights (mm) of males. Find the regression equation, letting foot length be the predictor (x) variable. Find the best predicted height of a male with a foot length of 272.7 mm. How does the result compare to the actual height of 1776 mm? Foot Length 282.3 277.8 252.8 258.7 279.0 258.4 274.1 261.7 Height 1785.0 1771.0 1675.7 1645.7 1859.3 1710.2 1789.2 1737.0 The regression equation is ŷ = + (x. (Round the y-intercept to the nearest integer as needed. Round the slope to two decimal places as needed.) The best predicted height of a male with a foot length of 272.7 mm is (Round to the nearest integer as needed.) How does the result compare to the actual height of 1776 mm? O A. The result is close to the actual height of 1776 mm. O B. The result is exactly the same as the actual height of 1776 mm. O C. The result is very different from the actual height of 1776 mm. O D. The result does not make sense given the context of the data. C mm.arrow_forward
- A group of researchers measured how funny people rated a cartoon when they were in one of two groups: holding a pen in their teeth (forcing them to smile) or holding a pen in their lips (forcing them to frown). For this study, identify the independent variable and the dependent variable. Justify your response.arrow_forwardThe accompanying table shows results from regressions performed on data from a random sample of 21 cars. The response (y) variable is CITY (fuel consumption in mi/gal). The predictor (x) variables are WT (weight in pounds), DISP (engine displacement in liters), and HWY (highway fuel consumption in mi/gal). The equation CITY - 3.17 +0.823HWY was previously determined to be the best for predicting city fuel consumption. A car weighs 2700 lb, it has an engine displacement of 1.6 L, and its highway fuel consumption is 35 mi/gal. What is the best predicted value of the city fuel consumption? Is that predicted value likely to be a good estimate? Is that predicted value likely to be very accurate? Click the icon to view the table of regression equations. The best predicted value of the city fuel consumption is (Type an integer or a decimal. Do not round.). Regression Table I R² Adjusted R2 WT/DISP WT/HWY Predictor (x) Variables P-Value WT/DISP/HWY 0.000 0.942 0.000 0.748 0.000 0.942 0.000…arrow_forwardRange of ankle motion is a contributing factor to falls among the elderly. Suppose a team of researchers is studying how compression hosiery, typical shoes, and medical shoes affect range of ankle motion. In particular, note the variables Barefoot and Footwear2. Barefoot represents a subject's range of ankle motion (in degrees) while barefoot, and Footwear2 represents their range of ankle motion (in degrees) while wearing medical shoes. Use this data and your preferred software to calculate the equation of the least-squares linear regression line to predict a subject's range of ankle motion while wearing medical shoes, ?̂ , based on their range of ankle motion while barefoot, ? . Round your coefficients to two decimal places of precision. ?̂ = A physical therapist determines that her patient Jan has a range of ankle motion of 7.26°7.26° while barefoot. Predict Jan's range of ankle motion while wearing medical shoes, ?̂ . Round your answer to two decimal places. ?̂ = Suppose Jan's…arrow_forward
- A negative correlation means that decreases in the X variable tend to be accompanied by decreases in the Y variable. T or Farrow_forwardThe accompanying table shows results from regressions performed on data from a random sample of 21 cars. The response (y) variable is CITY (fuel consumption in mi/gal). The predictor (x) variables are WT (weight in pounds), DISP (engine displacement in liters), and HWY (highway fuel consumption in mi/gal). Which regression equation is best for predicting city fuel consumption? Why? E Click the icon to view the table of regression equations. Choose the correct answer below. O A. The equation CITY = 6.65 - 0.00161WT + 0.675HWY is best because it has a low P-value and the highest adjusted value of R2. O B. The equation CITY = 6.83 - 0.00132WT - 0.253DISP + 0.654HWY is best because it has a low P-value and the highest value of R?. OC. The equation CITY = 6.83 - 0.00132WT - 0.253DISP + 0.654HWY is best because it uses all of the available predictor variables. O D. The equation CITY = - 3.14 + 0.823HWY is best because it has a low P-value and its R2 and adjusted R? values are comparable to…arrow_forwardThe correlation between two variables x and y is –0.6. If we used a regression line to predict y using x, what percent of the variation in y would be explained?arrow_forward
arrow_back_ios
arrow_forward_ios
Recommended textbooks for you
- MATLAB: An Introduction with ApplicationsStatisticsISBN:9781119256830Author:Amos GilatPublisher:John Wiley & Sons Inc
 Probability and Statistics for Engineering and th...StatisticsISBN:9781305251809Author:Jay L. DevorePublisher:Cengage Learning
 Statistics for The Behavioral Sciences (MindTap C...StatisticsISBN:9781305504912Author:Frederick J Gravetter, Larry B. WallnauPublisher:Cengage Learning
  Elementary Statistics: Picturing the World (7th E...StatisticsISBN:9780134683416Author:Ron Larson, Betsy FarberPublisher:PEARSON
 The Basic Practice of StatisticsStatisticsISBN:9781319042578Author:David S. Moore, William I. Notz, Michael A. FlignerPublisher:W. H. Freeman
 Introduction to the Practice of StatisticsStatisticsISBN:9781319013387Author:David S. Moore, George P. McCabe, Bruce A. CraigPublisher:W. H. Freeman
MATLAB: An Introduction with Applications
Statistics
ISBN:9781119256830
Author:Amos Gilat
Publisher:John Wiley & Sons Inc
Probability and Statistics for Engineering and th...
Statistics
ISBN:9781305251809
Author:Jay L. Devore
Publisher:Cengage Learning
Statistics for The Behavioral Sciences (MindTap C...
Statistics
ISBN:9781305504912
Author:Frederick J Gravetter, Larry B. Wallnau
Publisher:Cengage Learning
Elementary Statistics: Picturing the World (7th E...
Statistics
ISBN:9780134683416
Author:Ron Larson, Betsy Farber
Publisher:PEARSON
The Basic Practice of Statistics
Statistics
ISBN:9781319042578
Author:David S. Moore, William I. Notz, Michael A. Fligner
Publisher:W. H. Freeman
Introduction to the Practice of Statistics
Statistics
ISBN:9781319013387
Author:David S. Moore, George P. McCabe, Bruce A. Craig
Publisher:W. H. Freeman