ENGR.ECONOMIC ANALYSIS
14th Edition
ISBN: 9780190931919
Author: NEWNAN
Publisher: Oxford University Press
expand_more
expand_more
format_list_bulleted
Question

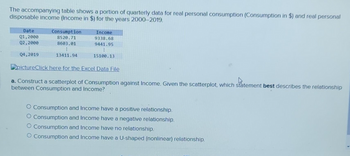
Transcribed Image Text:The accompanying table shows a portion of quarterly data for real personal consumption (Consumption in $) and real personal
disposable income (Income in $) for the years 2000-2019.
Date
Q1,2000
Q2, 2000
A
Q4,2019
Consumption
8520.71
8603.01
⠀
13411.94
Income
9338.68
9441.95
1
15100.13
pictureClick here for the Excel Data File
a. Construct a scatterplot of Consumption against Income. Given the scatterplot, which statement best describes the relationship
between Consumption and Income?
O Consumption and Income have a positive relationship.
O Consumption and Income have a negative relationship.
O Consumption and Income have no relationship.
O Consumption and Income have a U-shaped (nonlinear) relationship.
Expert Solution
This question has been solved!
Explore an expertly crafted, step-by-step solution for a thorough understanding of key concepts.
This is a popular solution
Trending nowThis is a popular solution!
Step by stepSolved in 4 steps with 1 images

Knowledge Booster
Learn more about
Need a deep-dive on the concept behind this application? Look no further. Learn more about this topic, economics and related others by exploring similar questions and additional content below.Similar questions
- A zero slope shows: positive relationship between two variables no relationship between two variables does not show anything negative relationship between two variablesarrow_forwardRefer to the figure below: Insurance and pensions 11.9% Item a. Entertainment b. Transportation c. Clothing Housing 32.8% Item Weight 0.053 0.159 0.03 Entertainment 5.3% Transportation 15.9% Price Change 20% -8% 100% Health care 8.1% Source: U.S. Bureau of Labor Statistics, Consumer Expenditure Survey (2018 data). Use the item weights in the figure to determine the percentage change in the CPI that would result from a(n) a. 20 percent increase in entertainment prices. b. 8 percent decrease in transportation costs. c. doubling of clothing prices. (Note: Review the table titled "Computing Changes in the CPI" in your text for assistance.) Instructions: Enter your responses as a percentage rounded to two decimal places. If you are entering any negative numbers be sure to include a negative sign (-) in front of those numbers. Food 12.9% Impact on CPI (Inflation Effect) Clothing 3.0% Miscellaneous 10.1%arrow_forwardNo written by hand solutionarrow_forward
- Y = C + /+ G Y = 5,000 (: G = 1,000 T = 1,000 (· C = 350+0.75(Y – T) (: | | = 1,000-50r Question Find total consumption expenditure and disposable income of household.arrow_forward7arrow_forwardMark Gershon, owner of a musical instrument distributorship, thinks that demand for guitars may be related to the number of television appearances by the popular group Maroon 5 during the previous month. Gershon has collected the data shown in the following table: Maroon 5 TV Appearances Demand for Guitars This exercise contains only part a. a) Graph these data using the point drawing tool. The plotted graph shows a pattern that can be described by: A. Seasonality C. Random variations 3 5 8 7 7 79 3 5 6 6 10 7 B. Trend O D. Cycles 12- 11- 10- 9- 8- 7- 6- 5- 4- 3- 2- 1- 0- Guitar Demand 4 TV Appearances -00 10 11arrow_forward
- We have obtained the following information about Real GDP in the U.S. economy from 1973:01 through 1975:Q++Data has been provided by the Bureau of Economic Analysis (BEA): Real GDP (billions of chained 2012 $) $5,646.3 $5,707.8 $5,677.7 $5,731.6 $5,682.4 $5,695.9 $5,642.0 $5,620.1 $5,551.7 $5,591.4 $5,687.1 $5,763.7 Year 1973 1974 1975 Quarter Q1 Q2 Q3 Q4 Q1 Q2 Q3 Q4 Q1 Q2 Q3 Q4 A. Create a graph of the above Real GDP data and label the phases of the Business Cycle (Peak, Trough, Recession, Recovery/Expansion). B. In what quarter did the U.S. economy reach a business cycle peak? C. In what quarter did the U.S. economy reach the trough of the business cycle? D. What was the percent decline in Real GDP from the business cycle peak to the trough? RGDP trough - RGDP peak Hint: Economic Growth Rate = x 100 RGDP peakarrow_forwardFor the next 6 questions, suppose that a simple economy produces only four goods and services: cars, homes, cheeseburgers and cheese. Assume all of the cheese are used in the production of the cheeseburgers. Also assume that Year 1 is the base year. The information used to answer the next 6 questions is below: Quantity (Year Product Quantity (Year 1) Price (Year 1) Price (Year 2) 2) Cars 50 25 100 30 Homes 10 30 15 50 Cheeseburgers 100 5 150 6 Cheese 50 1 75 3arrow_forwardDon't use Ai and chatgpt. Answer in step by step with explanationarrow_forward
arrow_back_ios
SEE MORE QUESTIONS
arrow_forward_ios
Recommended textbooks for you

 Principles of Economics (12th Edition)EconomicsISBN:9780134078779Author:Karl E. Case, Ray C. Fair, Sharon E. OsterPublisher:PEARSON
 Engineering Economy (17th Edition)EconomicsISBN:9780134870069Author:William G. Sullivan, Elin M. Wicks, C. Patrick KoellingPublisher:PEARSON
 Principles of Economics (MindTap Course List)EconomicsISBN:9781305585126Author:N. Gregory MankiwPublisher:Cengage Learning
 Managerial Economics: A Problem Solving ApproachEconomicsISBN:9781337106665Author:Luke M. Froeb, Brian T. McCann, Michael R. Ward, Mike ShorPublisher:Cengage Learning
 Managerial Economics & Business Strategy (Mcgraw-...EconomicsISBN:9781259290619Author:Michael Baye, Jeff PrincePublisher:McGraw-Hill Education


Principles of Economics (12th Edition)
Economics
ISBN:9780134078779
Author:Karl E. Case, Ray C. Fair, Sharon E. Oster
Publisher:PEARSON

Engineering Economy (17th Edition)
Economics
ISBN:9780134870069
Author:William G. Sullivan, Elin M. Wicks, C. Patrick Koelling
Publisher:PEARSON

Principles of Economics (MindTap Course List)
Economics
ISBN:9781305585126
Author:N. Gregory Mankiw
Publisher:Cengage Learning

Managerial Economics: A Problem Solving Approach
Economics
ISBN:9781337106665
Author:Luke M. Froeb, Brian T. McCann, Michael R. Ward, Mike Shor
Publisher:Cengage Learning

Managerial Economics & Business Strategy (Mcgraw-...
Economics
ISBN:9781259290619
Author:Michael Baye, Jeff Prince
Publisher:McGraw-Hill Education