MATLAB: An Introduction with Applications
6th Edition
ISBN: 9781119256830
Author: Amos Gilat
Publisher: John Wiley & Sons Inc
expand_more
expand_more
format_list_bulleted
Question
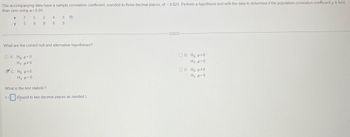
What is the test statistic?(round to two decimal places)
What is the pvalue?(round to three decimal places)
Reject or don’t reject the null hypothesis?

Transcribed Image Text:The accompanying data have sample correlation coefficient, rounded to three decimal places, of -0.621. Perform a hypothesis test with the data to determine if the population correlation coefficient p is less
than zero using a = 0.05.
X
V
7
5
OA. Ho: p=0
H₁: p#0
5
C. Ho: p²0
H₁: p<0
9
2
4
9 6
What are the correct null and alternative hypotheses?
5 D
8
What is the test statistic?
t=(Round to two decimal places as needed.)
OB. Ho p≤0
H₁: p>0
OD. Ho p#0
H₁: p=0
Expert Solution
This question has been solved!
Explore an expertly crafted, step-by-step solution for a thorough understanding of key concepts.
This is a popular solution
Trending nowThis is a popular solution!
Step by stepSolved in 2 steps with 1 images

Knowledge Booster
Similar questions
- When would you want to use a goodness-of-fit test? What are the requirements for this test?arrow_forwardFind the P-values while (hypothesis) testing mean.The principal of a school wants to test the average IQ of students at her school. She administers an IQ test to 64 randomly selected students. Among the sampled students, the sample average IQ is 108 and the sample standard deviation is 10. a) What is the P-value when testing the hypothesis that the average IQ is at least 110?P-value = (round to 4 decimals)b) What is the P-value when testing the hypothesis that the average IQ is at most 110?P-value = (round to 4 decimals)c) What is the P-value when testing the hypothesis that the average IQ is not 110?P-value = (round to 4 decimals)arrow_forwardUsing the two histograms and the bootstrap dotplot based on whether there is a difference between age and marital status (married/not married). What does this data tell us in terms of whether there is a difference between age and marital status or not? Does our interval include or exclude 0? What should we do with the null hypothesis?arrow_forward
- COLLAPSE What are p-values? Why are they important? What does a p-value tell us? Why are p-values often misunderstood and misused? When do we reject or fail to reject the Null Hypothesis based on p-values?arrow_forwardA psychologist wants to test whether there is any difference in puzzle-solving abilities between boys and girls. Independent samples of twelve boys and fourteen girls were chosen at random. The boys took a mean of 37 minutes to solve a certain puzzle, with a standard deviation of 4.3 minutes. The girls took a mean of 32 minutes to solve the same puzzle, with a standard deviation of 5.4 minutes. Assume that the two populations of completion times are normally distributed, and that the population variances are equal. Can we conclude, at the 0.05 level of significance, that the mean puzzle-solving times for boys, µ, differs from the mean puzzle-solving times for girls, µ,? Perform a two-tailed test. Then fill in the table below. Carry your intermediate computations to at least three decimal places and round your answers as specified in the table. (If necessary, consult a list of formulas.)arrow_forwardQ4- Please help me find the Test Statistics, P value and also with the last part of the question where it says " b " construct a cofidence interval suitable for testing..... same mean BMI . Thanks in advance.arrow_forward
- Previously, 43% of parents of children in high school felt it was a serious problem that high school students were not being taught enough math and science. A recent survey found that 144 of 300 parents of children in high school felt it was a serious problem that high school students were not being taught enough math and science do parents feel different today? Use the = 0.1 level of significance. what are the Null and alternative hypothesis? use technology to find the P value. P value =_. (round to three decimal places as needed.$ should one reject the null hypothesis? or should one not reject the null hypothesis?arrow_forwardwhat is the chi-square test for goodness of fit for the study (use the 0.01 level)State the null and research hypotheses?Determine the cutoff sample score at which the null hypothesis should be rejected.?what is the cutoff score ? Solve for A-F based on the chart attached?arrow_forwardPlease answer all 3partsarrow_forward
arrow_back_ios
arrow_forward_ios
Recommended textbooks for you
 MATLAB: An Introduction with ApplicationsStatisticsISBN:9781119256830Author:Amos GilatPublisher:John Wiley & Sons Inc
 Probability and Statistics for Engineering and th...StatisticsISBN:9781305251809Author:Jay L. DevorePublisher:Cengage Learning
 Statistics for The Behavioral Sciences (MindTap C...StatisticsISBN:9781305504912Author:Frederick J Gravetter, Larry B. WallnauPublisher:Cengage Learning
 Elementary Statistics: Picturing the World (7th E...StatisticsISBN:9780134683416Author:Ron Larson, Betsy FarberPublisher:PEARSON
 The Basic Practice of StatisticsStatisticsISBN:9781319042578Author:David S. Moore, William I. Notz, Michael A. FlignerPublisher:W. H. Freeman
 Introduction to the Practice of StatisticsStatisticsISBN:9781319013387Author:David S. Moore, George P. McCabe, Bruce A. CraigPublisher:W. H. Freeman

MATLAB: An Introduction with Applications
Statistics
ISBN:9781119256830
Author:Amos Gilat
Publisher:John Wiley & Sons Inc

Probability and Statistics for Engineering and th...
Statistics
ISBN:9781305251809
Author:Jay L. Devore
Publisher:Cengage Learning

Statistics for The Behavioral Sciences (MindTap C...
Statistics
ISBN:9781305504912
Author:Frederick J Gravetter, Larry B. Wallnau
Publisher:Cengage Learning

Elementary Statistics: Picturing the World (7th E...
Statistics
ISBN:9780134683416
Author:Ron Larson, Betsy Farber
Publisher:PEARSON

The Basic Practice of Statistics
Statistics
ISBN:9781319042578
Author:David S. Moore, William I. Notz, Michael A. Fligner
Publisher:W. H. Freeman

Introduction to the Practice of Statistics
Statistics
ISBN:9781319013387
Author:David S. Moore, George P. McCabe, Bruce A. Craig
Publisher:W. H. Freeman