MATLAB: An Introduction with Applications
6th Edition
ISBN: 9781119256830
Author: Amos Gilat
Publisher: John Wiley & Sons Inc
expand_more
expand_more
format_list_bulleted
Concept explainers
Topic Video
Question
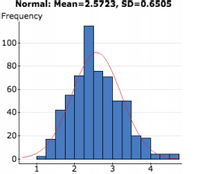
The 12th earthquake listed on Data Set 21 had a magnitude of 2.83.
Find the z score corresponding to this magnitude.
Use graph attached for

Transcribed Image Text:Normal: Mean=2.5723, SD=0.6505
Frequency
100
80
60
40
20
2
3
Expert Solution
This question has been solved!
Explore an expertly crafted, step-by-step solution for a thorough understanding of key concepts.
This is a popular solution
Trending nowThis is a popular solution!
Step by stepSolved in 2 steps

Knowledge Booster
Learn more about
Need a deep-dive on the concept behind this application? Look no further. Learn more about this topic, statistics and related others by exploring similar questions and additional content below.Similar questions
- Please be sure answers are correct.arrow_forwardA manufacturer of bolts has a quality-control policy that requires it to destroy any bolts that are more than 4 standard deviations from the mean. The quality-control engineer knows that the bolts coming off the assembly line have mean length of 15 cm with a standard deviation of 0.10 cm. For what lengths will a bolt be destroyed? Select the correct choice below and fill in the answer box(es) to complete your choice. (Round to one decimal place as needed.) OA. A bolt will be destroyed if the length is less than OB. A bolt will be destroyed if the length is between OC. A bolt will be destroyed if the length is greater than OD. A bolt will be destroyed if the length is less than cm. cm and cm. cm cm or greater than cm. DIarrow_forwardPlease solve the screenshot and use tables from Google as needed!arrow_forward
- uno nuevaarrow_forwardCars on I-40 have a mean speed of 73 MPH at a certain mile marker, with a standard deviation of 8 MPH. What Percentage of Cars averaged at least 78 mph?arrow_forwardA survey of 137 investment managers in a poll revealed the following. • 46% of managers classified themselves as bullish or very bullish on the stock market. • The average expected returm over the next 12 months for egquities was 11.5%. - 21% selected health care as the sector most likely to lead the market in the next 12 months. • When asked to estimate how long it would take for technology and telecom stocks to resume sustainable growth, the managers' average response was 2.8 years (a) Cite two descriptive statistics. (Select all that apply.) O of those investment managers surveyed, 46% were bulish or very bullish on the stock market. O of those investment managers surveyed, 21% selected health care as the sector most likely to lead the market in the next 12 months. D of those investment managers surveyed, 46% were bulish or very bullish on health care stocks over the next 2.8 years. D of those linvestment managers surveyed, 11.5% expect it would take 12 months for equities to resume…arrow_forward
- If you buy one ticket everyday for 365 days, find the mean and standard deviation for the numbers of winning tickets in such groups of 365 tickets. Round to three decimal placesarrow_forwardA quantitative data set has a size 50. At least how many observations lie within 3standard deviations to either side of the mean?arrow_forwardUse the magnitudes (Richter scale) of the 120 earthquakes listed in the accompanying data table. Use technology to find the range, variance, and standard deviation. If another value, 8.00, is added to those listed in the data set, do the measures of variation change much? Click the icon to view the table of magnitudes. Magnitudes Without the extra data value, the range is (Type an integer or decimal rounded to three decimal places as needed.) 3.28 2.82 2.83 1.96 1.70 2.55 O 2.45 3.40 3.95 1.59 2.91 1.63 2.53 2.42 2.97 2.93 3.99 2.54 2.43 1.83 2.17 2.35 2.00 3.01 2.80 3.86 2.93 2.08 1.86 2.35 2.38 3.45 3.43 1.55 2.54 1.49 2.19 3.09 2.28 3.25 1.98 1.91 2.42 2.95 2.14 2.33 2.56 2.89 1.48 1.91 2.68 1.81 3.65 2.70 1.45 3.61 3.14 2.57 1.51 1.41 2.83 2.87 2.18 1.67 3.21 1.39 1.75 2.35 1.14 2.36 2.48 1.79 2.00 3.03 1.94 2.42 1.86 2.25 2.33 3.17 4.01 2.08 1.49 2.31 2.33 2.56 2.59 2.21 2.75 2.45 2.73 3.58 2.81 2.80 3.25 1.76 4.68 3.23 2.38 2.00 3.83 2.39 2.85 3.38 2.69 2.31 2.83 2.78 2.43 2.34…arrow_forward
arrow_back_ios
SEE MORE QUESTIONS
arrow_forward_ios
Recommended textbooks for you
 MATLAB: An Introduction with ApplicationsStatisticsISBN:9781119256830Author:Amos GilatPublisher:John Wiley & Sons Inc
 Probability and Statistics for Engineering and th...StatisticsISBN:9781305251809Author:Jay L. DevorePublisher:Cengage Learning
 Statistics for The Behavioral Sciences (MindTap C...StatisticsISBN:9781305504912Author:Frederick J Gravetter, Larry B. WallnauPublisher:Cengage Learning
 Elementary Statistics: Picturing the World (7th E...StatisticsISBN:9780134683416Author:Ron Larson, Betsy FarberPublisher:PEARSON
 The Basic Practice of StatisticsStatisticsISBN:9781319042578Author:David S. Moore, William I. Notz, Michael A. FlignerPublisher:W. H. Freeman
 Introduction to the Practice of StatisticsStatisticsISBN:9781319013387Author:David S. Moore, George P. McCabe, Bruce A. CraigPublisher:W. H. Freeman

MATLAB: An Introduction with Applications
Statistics
ISBN:9781119256830
Author:Amos Gilat
Publisher:John Wiley & Sons Inc

Probability and Statistics for Engineering and th...
Statistics
ISBN:9781305251809
Author:Jay L. Devore
Publisher:Cengage Learning

Statistics for The Behavioral Sciences (MindTap C...
Statistics
ISBN:9781305504912
Author:Frederick J Gravetter, Larry B. Wallnau
Publisher:Cengage Learning

Elementary Statistics: Picturing the World (7th E...
Statistics
ISBN:9780134683416
Author:Ron Larson, Betsy Farber
Publisher:PEARSON

The Basic Practice of Statistics
Statistics
ISBN:9781319042578
Author:David S. Moore, William I. Notz, Michael A. Fligner
Publisher:W. H. Freeman

Introduction to the Practice of Statistics
Statistics
ISBN:9781319013387
Author:David S. Moore, George P. McCabe, Bruce A. Craig
Publisher:W. H. Freeman