MATLAB: An Introduction with Applications
6th Edition
ISBN: 9781119256830
Author: Amos Gilat
Publisher: John Wiley & Sons Inc
expand_more
expand_more
format_list_bulleted
Topic Video
Question

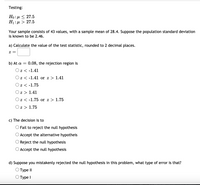
Transcribed Image Text:Testing:
Но: д < 27.5
H1: µ > 27.5
Your sample consists of 43 values, with a sample mean of 28.4. Suppose the population standard deviation
is known to be 2.46.
a) Calculate the value of the test statistic, rounded to 2 decimal places.
= Z
b) At a = 0.08, the rejection region is
Оz<-1.41
Oz < -1.41 or z > 1.41
Oz < -1.75
Oz > 1.41
Oz < -1.75 or z > 1.75
Oz > 1.75
c) The decision is to
O Fail to reject the null hypothesis
O Accept the alternative hypotheis
Reject the null hypothesis
Accept the null hypothesis
d) Suppose you mistakenly rejected the null hypothesis in this problem, what type of error is that?
Туре II
О Туре I
Expert Solution
This question has been solved!
Explore an expertly crafted, step-by-step solution for a thorough understanding of key concepts.
Step by stepSolved in 4 steps with 1 images

Knowledge Booster
Learn more about
Need a deep-dive on the concept behind this application? Look no further. Learn more about this topic, statistics and related others by exploring similar questions and additional content below.Similar questions
- Testing:H0:μ=38.5H1:μ<38.5Your sample consists of 35 subjects, with a mean of 38.3 and a standard deviation of 1.93.Calculate the test statistic, rounded to 2 decimal places. t =arrow_forwardCan you please check my workarrow_forwardAt a certain high school, every freshman has his or her height The freshman boys have a mean height of 65.2 inches and a standard deviation of 3.2 inches. The freshman girls have a mean height of 63.5 inches and a standard deviation of 2.7 inches. The proportion of of freshman girls has heights between 60 to 65 inches is 0.6133. What is the interpretation of this normal density area? (i) The proportion of freshman having heights between 60 to 65 inches is 0.6133 (ii) The probability that a randomly selected freshman girl have heights between 60 to 65 inches is 0.6133 or 61.33% Oboth (i) and (ii) are correct We can not interpret the given area..arrow_forward
- Compute the range and sample standard deviation for strength of the concrete (in psi). 3920, 4070, 3500, 3100, 2930, 3870, 4070, 4010 The range is S= psi. psi (Round to one decimal place as needed.)arrow_forwardAnswer the exercise of the image. (In the other image are the final answers, this to verify the final answer).arrow_forwardScores on a standardized exam are normally distributed with a mean of 517 and a standard deviation of 60. The figure below shows the distribution of the scores on a standardized exam. Cal- culate the shaded area under the curve. Express your answer in decimal form accurate to at least two decimal places. Answer: 397 457 The Scores on a Standardized Exanarrow_forward
- The time to complete an exam is approximately Normal with a mean m=39 minutes and Standard deviation o = 3 min. 95% of testing time were between______ minutes and______?__minutes. ___?____% of testing were betweenthe ti 36 and 42 minutesarrow_forwardClaim: The mean systolic blood pressure of all healthy adults is less than than 125 mm Hg. Sample data: For 266 healthy adults, the mean systolic blood pressure level is 124.47 mm Hg and the standard deviation is 15.29 mm Hg. The null and alternative hypotheses are Ho: μ = 125 and H₁: µ< 125. Find the value of the test statistic. C The value of the test statistic is. Round to two decimal places as needed.) ple Get more help - A X Question 6 (0/1) ✓ Question 10 (1/1) Question 7 (0.67/1) 4 Clear all Check answe Question 8 (0.67/1)arrow_forwardClaim: The standard deviation of pulse rates of adult males is less than 11 bpm. For a random sample of 128 adult males, the pulse rates have a standard deviation of 10.8 bpm. Find the value of the test statistic. The value of the test statistic is (Round to two decimal places as needed.)arrow_forward
arrow_back_ios
arrow_forward_ios
Recommended textbooks for you
 MATLAB: An Introduction with ApplicationsStatisticsISBN:9781119256830Author:Amos GilatPublisher:John Wiley & Sons Inc
 Probability and Statistics for Engineering and th...StatisticsISBN:9781305251809Author:Jay L. DevorePublisher:Cengage Learning
 Statistics for The Behavioral Sciences (MindTap C...StatisticsISBN:9781305504912Author:Frederick J Gravetter, Larry B. WallnauPublisher:Cengage Learning
 Elementary Statistics: Picturing the World (7th E...StatisticsISBN:9780134683416Author:Ron Larson, Betsy FarberPublisher:PEARSON
 The Basic Practice of StatisticsStatisticsISBN:9781319042578Author:David S. Moore, William I. Notz, Michael A. FlignerPublisher:W. H. Freeman
 Introduction to the Practice of StatisticsStatisticsISBN:9781319013387Author:David S. Moore, George P. McCabe, Bruce A. CraigPublisher:W. H. Freeman

MATLAB: An Introduction with Applications
Statistics
ISBN:9781119256830
Author:Amos Gilat
Publisher:John Wiley & Sons Inc

Probability and Statistics for Engineering and th...
Statistics
ISBN:9781305251809
Author:Jay L. Devore
Publisher:Cengage Learning

Statistics for The Behavioral Sciences (MindTap C...
Statistics
ISBN:9781305504912
Author:Frederick J Gravetter, Larry B. Wallnau
Publisher:Cengage Learning

Elementary Statistics: Picturing the World (7th E...
Statistics
ISBN:9780134683416
Author:Ron Larson, Betsy Farber
Publisher:PEARSON

The Basic Practice of Statistics
Statistics
ISBN:9781319042578
Author:David S. Moore, William I. Notz, Michael A. Fligner
Publisher:W. H. Freeman

Introduction to the Practice of Statistics
Statistics
ISBN:9781319013387
Author:David S. Moore, George P. McCabe, Bruce A. Craig
Publisher:W. H. Freeman